
Market Video Report: Bitcoin Duration 9:41 mins. Summary Bitcoin has failed its bull breakout from the cup and handle pattern. After the market found no follow-through above the handle, the bears took control, making a test of the trading range lows the highest probability outcome. On the daily chart, this bear breakout is likely to […]
Gold Largest One-Week Dollar Gain on Record!
Gold GC-Mini Market Analysis The Gold GC-mini continued its parabolic ascent towards the psychological milestone of $5000. Gold continues to outperform other traditional safe havens, such as bonds and, in particular, bitcoin. A bit of caution is in order, Gold may be reaching a point where traders must consider the sustainability of such a parabolic […]
Nasdaq 100 Buy Signal at Weekly Ema
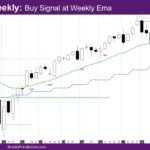
Market Overview: NASDAQ 100 E-mini Futures The NASDAQ E-mini futures week is a buy signal at weekly EMA – exponential moving average. The weekly and daily chart is at the apex of a triangle in a continued sideways breakout mode pattern. The weekly chart finally has a reasonable buy signal at the weekly EMA. The […]
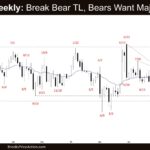
Nifty 50 Near Channel Bottom
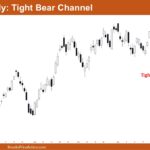
Market Overview: Nifty 50 Futures Nifty 50 Near Channel Bottom. This week, the market delivered a very strong bear close near the lower trend line of the broad bull channel. On the weekly chart, the market appears to be in a trading range price action phase, so traders should manage their positions accordingly. On the […]
E-mini Likely to Reach January 20th Close
Trading Update: Friday January 23, 2026 S&P E-mini market analysis E-mini daily chart E-mini 5-minute chart and what to expect today Yesterday’s E-mini setups Richard created the SP500 E-mini chart. Here are reasonable stop entry setups from yesterday. Chart shows each buy entry bar with a green arrow and each sell entry bar with a […]
E-mini Bad Context For Bulls
Trading Update: Thursday January 22, 2026 S&P E-mini market analysis E-mini daily chart E-mini 5-minute chart and what to expect today Yesterday’s E-mini setups Richard created the SP500 E-mini chart. Here are reasonable stop entry setups from yesterday. Chart shows each buy entry bar with a green arrow and each sell entry bar with a […]
Strong Bear Breakout on the Daily Chart
Trading Update: Wednesday January 21, 2026 S&P E-mini market analysis E-mini daily chart E-mini 5-minute chart and what to expect today Yesterday’s E-mini setups Richard created the SP500 E-mini chart. Here are reasonable stop entry setups from yesterday. Chart shows each buy entry bar with a green arrow and each sell entry bar with a […]
E-Mini Bears Likely to Get 2nd Leg Down
Trading Update: Tuesday January 20, 2026 S&P E-mini market analysis E-mini daily chart E-mini 5-minute chart and what to expect today Friday’s E-mini setups Richard created the SP500 E-mini chart. Here are reasonable stop entry setups from Friday (before US holiday break). Chart shows each buy entry bar with a green arrow and each sell […]
E-mini Bulls Want a Strong Breakout Above
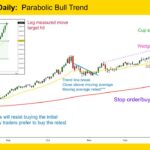
Market Overview: S&P 500 E-mini Futures The S&P 500 E-mini bulls want a strong breakout above to increase the odds of a trend resumption. Bears want the October 29 high area to act as resistance; if the market trades higher, they hope follow-through buying will be weak, resulting in a failed breakout. S&P500 E-mini futures […]
Crude Oil Major Lower High
Market Overview: Crude Oil Futures The market formed a Crude oil major lower high this week (January 14). Bulls need consecutive strong bull bars closing well above the 20-week EMA and the bear trend line to show they are regaining control. Bears want another strong leg down from a large wedge bear flag (July 30, […]

