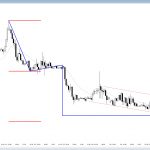
Posted 6:54 a.m. Friday was a sell climax. Today had a 75% chance of at least a couple of hours of sideways to up trading beginning by the end of the 2nd hour. It might have begun at the end of Friday. The Emini began with a series of bull trend bars that rallied above […]
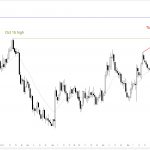
Intraday market update: May 16, 2016
Emini weekend update: May 14, 2016:
Trade a trend reversal candlestick pattern
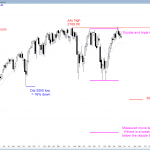
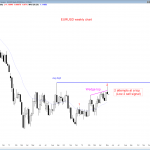
Monthly S&P500 Emini futures candlestick chart: Might trigger sell signal The monthly S&P500 Emini futures candlestick chart is moving down and it might fall below last month’s low. This would trigger a sell signal for a failed breakout above a 2 year trading range. The monthly S&P500 Emini futures candlestick chart still has not triggered […]
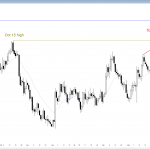
Intraday market update: May 13, 2016
Learn how to trade a triangle candlestick pattern
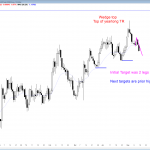
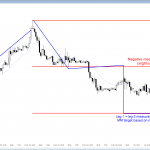
Posted 7:02 a.m. The Emini rallied on the open after a breakout test of yesterday’s 10:05 a.m. breakout point. The Emini will probably get a 2nd leg up today and reach a Leg 1 = Leg 2 target, but the bear channel at the end of yesterday was tight. This often means that the bulls […]
Intraday market update: May 12, 2016
Learn to trade opposite candlestick patterns
Posted 6:52 a.m. After 2 days of extreme trending and bad limit order trading, the odds are that today will have a lot of limit order trading. Traders are uncertain and they will be quick to take profits. In the 1st 4 bars, both limit order bulls and bears made money. While it is likely […]
Intraday market update: May 11, 2016
Learn how to trade buy climax candlestick pattern
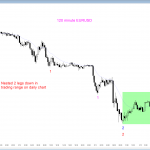
Posted 7:07 a.m. The day began with a gap down. Both bulls and bears made money with limit orders. This increased the chances for a lot of trading range price action today. The bulls so far are not getting their follow-through buying. There was a 75% chance of at least 2 hours of sideways to […]
Intraday market update: May 10, 2016
Price action trading strategy is expect 2nd leg up
I will post around 7:11 a.m. The Emini gapped above yesterday’s high, creating the possibility of a bull breakout above a 60 minute, 2 day bear flag and a measured move up. Although today began as a trend from the open bull trend, the follow-through buying was not strong. This makes a big bull trend […]
Intraday market update: May 9, 2016
Learn how to trade a minor candlestick pattern buy signal
Posted 7:10 a.m. The Emini continued Friday’s rally on the open, but the rally has now lasted over 60 bars in a relatively tight bull channel. This reduces the chances of a big bull trend day, even though the Emini triggered the Wedge Bull Flag buy when it traded above Friday’s high. Not only is […]
Emini weekend update: May 7, 2016:
Learn how to trade a wedge bull flag candlestick pattern
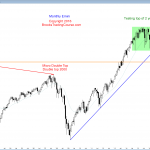
Monthly S&P500 Emini futures candlestick chart: Sell signal bar The monthly S&P500 Emini futures candlestick chart reversed down in April after reaching a new all-time high. That makes April a sell signal bar on the monthly chart. If the monthly S&P500 Emini futures candlestick chart trades 1 tick below the April low of 2026, it […]
Intraday market update: May 6, 2016
Learn how to day trade a wedge bottom
Posted 6:54 a.m. The Emini reversed up from below yesterday’s low and from below the wedge bottom. However, the 1st 3 bars had big tails, and the bar closed back below the top of yesterday’s 2 hour Final Flag. This increases the chances of a lot of trading range price action, like yesterday. The bulls […]
Intraday market update: May 5, 2016
Learn how to trade swing trading price action
Posted 7:00 a.m. The Emini began with a limit order market just below yesterday’s high and the 60 minute moving average. The bulls want to get above yesterday’s high to trigger the buy signal on the daily chart. The 3 weeks down have created a wedge bull flag. The bears don’t care if the buy […]

