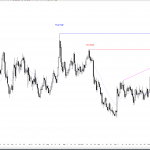
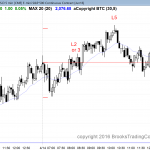
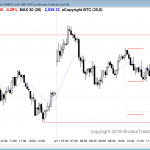
Posted 7:00 a.m. The Emini reversed up from below yesterday’s low in the first minute of the day. Although it had several consecutive bull bars, they had prominent tails. This happens more in a bull leg in a trading range than in a bull trend. Unless the bulls get a strong bull breakout above the […]
Intraday market update: April 22, 2016
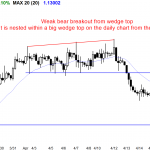
Intraday market update: April 21, 2016
Price action favors trading range candlestick pattern today
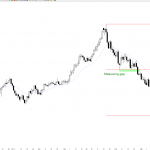
Posted 7:12 a.m. The Emini sold off on the open to the 60 minute moving average. Yesterday was a sell signal bar on the daily chart, and today’s selloff is near the support of yesterday’s low. The selloff has been strong enough for today to trigger the short below yesterday’s low. However, the selloff is […]
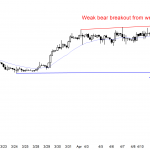
Intraday market update: April 20, 2016
Online day traders expect breakout price action
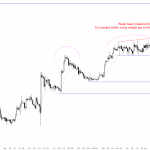
Posted 6:46 a.m. The quiet, tight bull channel from yesterday continued on the open today. The bulls want the reversal up from the moving average to be an Opening Reversal that leads to a new all-time high. The bears want the weak rally fro 41 yesterday to be a leg in a trading range. Until […]
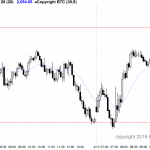
Emini weekend update: April 16, 2016:
Candlestick pattern is a possible Final Flag
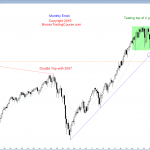
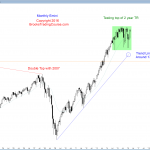
Monthly S&P500 Emini futures candlestick chart: Testing all-time high The monthly S&P500 Emini futures candlestick chart has had 3 strong bull trend bars, but it has not yet broken above the top of the 2 year trading range. On the monthly S&P500 Emini futures candlestick chart, the Emini is still at the top of its […]
Intraday market update: April 15, 2016
Learn how to trade doji candlestick patterns
Posted 6:56 a.m. Yesterday is a sell signal bar on the daily chart, but it is a doji after 2 good bull bars. The odds are that there will be buyers below yesterday’s low. The bears want a bear trend, but the bulls scalpers have already made money twice today and the bear bars are […]
Intraday market update: April 14, 2016
Learn how to trade price action at resistance
Posted 7:06 a.m. The Emini reversed down from above yesterday’s high, but it lacked consecutive big bear trend bars. The odds are that yesterday’s bull channel was a bull leg in what will become a trading range. The Emini is Always In Short, and it probably will test higher lows in yesterday’s channel. It might […]
Intraday market update: April 13, 2016
Learn how to trade a possible new all time high
Posted 7:05 a.m. The Emini gapped up and had 3 early bull bars, but the bars overlapped and had tails. This was a weak opening for the bulls. Also, limit order bears made money twice in the 1st 5 bars. This is not how bull trends typically begin and it increases the chances of a […]
Intraday market update: April 12, 2016
Learn how to trade a failed Head and Shoulders
Posted 7:04 a.m. The Emini rallied on the open, but the 1st 3 bull bars had tails, and limit order bear scalpers made money. Also, the Emini stalled at the 60 minute EMA, which was support yesterday and therefore possibly resistance today. This makes the rally more likely a bull leg in a trading range. […]
Intraday market update: April 11, 2016
Price action creating breakout mode candlestick patterns
Posted 6:57 a.m. The Emini gapped up but entered a tight trading range, and it is near the top of a week trading range. This reduces the chances of a trend today, and it increases the chances for a lot of trading range price action. This means that the odds are that there will be […]
Emini weekend update: April 9, 2016:
Candlestick patterns have created breakout mode price action
Monthly S&P500 Emini futures candlestick chart: Testing top of bull flag The monthly S&P500 Emini futures candlestick chart has still not broken above the 2 year bull flag, despite the strong 2 month rally. The monthly S&P500 Emini futures candlestick chart continues to have 1 – 2 big bars up and down in a tight […]

