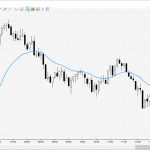
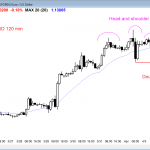
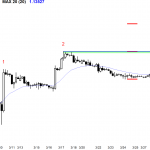
Posted 7:34 a.m. The bulls had a big gap up and want a rally to above Wednesday’s lower high to end the head and shoulders top. The bears got a parabolic wedge top, which is usually followed by a trading range or an hour or so. At that point, if the bears get a strong […]
Intraday market update: April 8, 2016
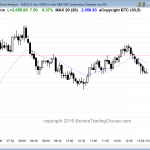
Intraday market update: April 7, 2016
Day trading tip is to look for sell candlestick patterns
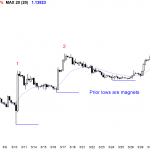
Posted 7:05 a.m. The Emini opened with a big gap down. It tested yesterday’s higher low and tried to form a big double bottom bull flag. It has been in a tight trading range and it is in breakout mode. Since it is at support, the odds favor a bull breakout and a measured move […]
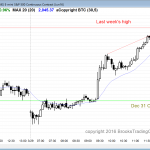
Intraday market update: April 6, 2016
Learn how to trade quiet price action
Posted 7:15 a.m. Yesterday ended with an expanding triangle bottom at the bottom of a 4 day trading range. Today had an early higher low major trend reversal, but the 4 bull bars were not big and had tails. This is more trading range price action. Bulls and bears made money with limit order scalps, […]
Intraday market update: April 5, 2016
Learn how to trade evolving price action
Posted 6:55 a.m. The Emini opened with a big gap down, and it sold off on the open. When there is a big gap down and an early selloff, the selloff usually lasts about 5 – 10 bars and then the Emini goes sideways to up to the moving average over the next couple of […]
Intraday market update: April 4, 2016
Learn how to trade price action at the all time high
Posted 7:07 a.m. The bulls tried for follow-through buying on the open, but the rally lacked consecutive big bull trend bars. It is still unclear if there will be an hour or two rally and then a trading range, or if the 2 hour sideways to down price action has already begin. The odds of […]
Emini weekend update: April 2, 2016:
Swing traders see the buy climax candlestick pattern continuing
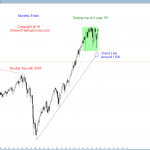
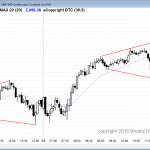
Monthly S&P500 Emini futures candlestick chart: Strong rally that is testing top of 2 year trading range The monthly S&P500 Emini futures candlestick chart rallied strongly in March and is testing the top of its 2 year trading range. The monthly S&P500 Emini futures candlestick chart has again rallied strongly to the top of its […]
Intraday market update: April 1, 2016
Candlestick pattern is a 2 day island top
Posted 6:57 a.m. The Emini opened with a big gap down and 3 bear bars, but both had big tails below, and bull scalpers made money buying at the low of the prior bar. That is not what typically happens in a bear trend. It increases the chances of the Emini being mostly sideways to […]
Intraday market update: March 31, 2016
Online day trading when the price action is quiet
Posted 7:01 a.m. The Emini began with a tight trading range within yesterday’s range. This increase the chances of a lot of trading range price action today. A trading range day has at least one leg up and one leg down, but it is impossible to know which will come 1st until after it has […]
Intraday market update: March 30, 2016
Day traders see the weekly candlestick pattern as a breakout
Posted 6:52 a.m. The Emini gapped up and rallied. When that happens, especially after a buy climax, the rally usually lasts 5 – 10 bars and then the Emini enters a tight trading range for a couple of bars. This is what is most likely today. It sometimes forms a parabolic wedge top and a […]
Intraday market update: March 29, 2016
Day trading tip is to look for scalping candlestick patterns
Posted 7:13 a.m. The Emini had a gap down and traded below yesterday’s low, but the 1st 5 bars had big tails below and were in a tight trading range. The Emini reversed up from a small double bottom for a failed breakout below yesterday’s low and a possible low of the day. The rally […]

