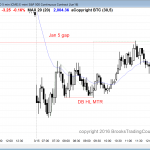
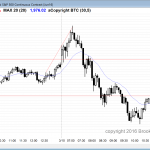
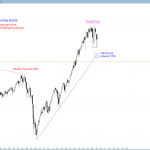
Posted 6:52 a.m. The Emini gapped down and triggered the Low 5 sell signal on the daily chart. It reversed up after closing the gap above Thursday’s high and the test below the 60 minute moving average. The initial reversal up was not strong. The 1st 2 bars were not big and they had prominent […]
Intraday market update: March 15, 2016
Intraday market update: March 14, 2016
Learn how to trade the markets after a buy climax
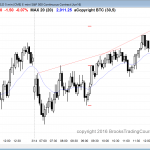
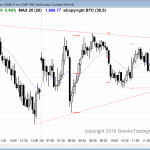
Posted 7:15 a.m. Yesterday was in a bull channel, but it contained mostly small overlapping dojis, which means that it was probably going to be a bull leg in a trading range. Today broke below the bull channel on the open, but the small bars continued on the open. This increases the chances that today […]
Emini weekend update: March 12, 2016:
Bullish price action but buy climax
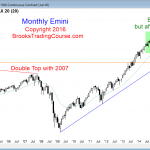
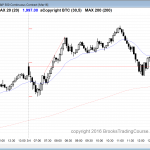
Monthly S&P500 Emini futures candlestick chart: Bull flag after buy climax The monthly S&P500 Emini futures candlestick chart has a strong entry bar so far for the buy above last month’s buy signal bar, but it is still within a 2 year trading range after a buy climax. The monthly S&P500 Emini futures candlestick […]
Intraday market update: March 11, 2016
Learn how to day trade an expanding triangle
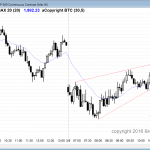
Posted 6:54 a.m. Although today gapped above last yesterday’s high and traded above last week’s high, it opened with a tight trading range and small bars. This makes it likely to have limited upside. Any reversal down would trigger an expanding triangle top and a failed breakout above last week’s high, but the bears will […]
Intraday market update: March 10, 2016
Bullish price action for online day traders
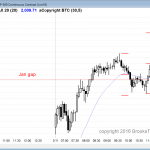
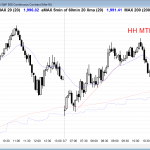
Posted 7:02 a.m. The Emini broke above yesterday’s high, triggering the High 1 buy setup on the daily chart, but because the 5 day rally was climactic, the Emini might need to pull back and form a High 2 buy setup before it can have its 3 – 5 day rally. The 1st 4 bars […]
Intraday market update: March 9, 2016
Day trading tip is to expect bullish price action
Posted 6:57 a.m. Today began with reversals, big bars, prominent tails, which is trading range price action, and it took place between the 5 and 60 minute moving averages. This increases the chance of more trading range price action throughout the day. The bulls want a higher low major trend reversal. The bears want another […]
Intraday market update: March 8, 2016
Learn how to trade a buy climax pullback
Posted 7:07 a.m. The Emini traded below yesterday’s low, creating the pullback on the daily chart. The odds are that it will be bought and be followed by a 1 – 3 day rally to above the March high, and then have a trading range. What we do not yet know is how far below […]
Intraday market update: March 7, 2016
Emini price action favors short day trades today
Posted 7:03 a.m. The Emini reversed up from the 60 minute moving average and rallied above Friday’s bear low, but the rally contained 3 dojis, and the buy signal bar was weak. This means that the rally was likely just a bear leg in a trading range. The selloff had a bull doji sell signal […]
Emini weekend update: March 5, 2016:
Learn how to trade a Low 4 sell climax candlestick pattern
Monthly S&P500 Emini futures candlestick chart: Middle of trading range The monthly S&P500 Emini futures candlestick chart is in the middle of its 2 year trading range after a 38 month buy climax. The monthly Emini chart is still recovering from a buy climax. It held above the 20 month EMA for 38 months, which […]
Intraday market update: March 4, 2016
Learn how to trade futures in a buy climax
Posted 7:02 a.m. The Emini reversed down on the open from the top of the 5 minute channel. Because the channel is tight, the odds favor a trading range before a bear trend, but since both the 60 minute and daily charts are in buy climaxes, there is a 70% chance of at least a […]

