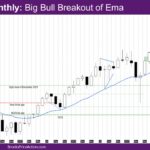
Market Overview: NASDAQ 100 E-mini Futures The NASDAQ E-mini futures April 2026 is a big bull breakout of EMA – exponential moving average. It is possibly the biggest bull bar ever. The week is a smaller bull bar compared to the bull bars of the past four weeks. This week makes it a 4-bar bull […]
Nasdaq 100 4CC Bull Trend Bar and All-Time High Close
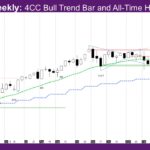
Market Overview: NASDAQ 100 E-mini Futures The NASDAQ E-mini futures week is a 4CC bull trend bar and all-time high close – 4CC meaning 4th consecutive. The daily chart started the channel phase this week after the spike last week – inside day, alternate bull/bear days, as well as a pullback day. The monthly bar […]
Nasdaq 100 3CC Bull Trend Bar and All-Time High Close
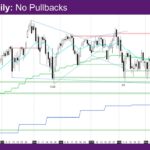
Market Overview: NASDAQ 100 E-mini Futures The NASDAQ E-mini futures week is a 3CC bull trend bar and all-time high close – 3CC meaning three consecutive. The daily chart is exceptionally strong – a bull micro-channel, i.e., no pullback, with most days being big bull trend bars. The monthly bar is even bigger than last […]
Nasdaq 100 First Close Above Ema Since Early February
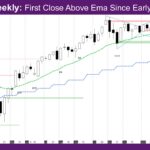
Market Overview: NASDAQ 100 E-mini Futures The NASDAQ E-mini futures week is a bull trend bar and a good entry to last week’s buy signal bar. It is the first close above EMA since early February. The EMA is the 20-period exponential moving average. The daily chart is exceptionally strong – all days were bull […]
Nasdaq 100 First Monthly Bar at Ema Since March 2025

Market Overview: NASDAQ 100 E-mini Futures The NASDAQ E-mini futures March 2026 is the first monthly bar at EMA since March 2025. It is a bear bar with prominent tails reversing at the monthly exponential moving average (EMA). The week is a big bull trend bar reversing at monthly EMA after several weeks of bear […]
Nasdaq 100 First Close Below Monthly Ema Since March 2025

Market Overview: NASDAQ 100 E-mini Futures The NASDAQ E-mini futures week is a bear bar with a first close below monthly EMA since March 2025. The EMA is the 20-period exponential moving average. The daily chart had a big pullback Monday, followed by sideways for a couple days, and then a bear resumption. There are […]
Nasdaq 100 Bull Body Gap from August 2025 Closed

Market Overview: NASDAQ 100 E-mini Futures The NASDAQ E-mini futures week is another bear bar with prominent tails, with the bull body gap from August 2025 closed on the daily chart and the weekly in a leg in trading range to monthly exponential moving average (EMA). The daily chart continued a leg up to the […]
Nasdaq 100 Close Below November Low Close
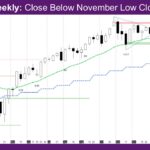
Market Overview: NASDAQ 100 E-mini Futures The NASDAQ E-mini futures week is another doji bear bar that finally has a close below November low close. The daily chart continues to be sideways between the daily/weekly exponential moving average (EMA) and the November low close. NASDAQ 100 Emini futures The Weekly NASDAQ chart The Daily NASDAQ […]
Nasdaq 100 Consecutive Dojis

Market Overview: NASDAQ 100 E-mini Futures The NASDAQ E-mini futures week is another doji bear bar – consecutive dojis. The daily chart is sideways between the daily/weekly exponential moving average (EMA) and the November low close. NASDAQ 100 Emini futures The Weekly NASDAQ chart The Daily NASDAQ chart Market analysis reports archive You can access […]
Nasdaq 100 January Doji Sell Signal Triggered
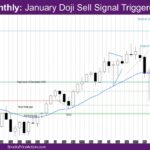
Market Overview: NASDAQ 100 E-mini Futures The NASDAQ E-mini futures February 2025 month is a bear bar with prominent tails. The January doji sell signal triggered when this month fell below the January low. The week is a doji bear bar below the weekly exponential moving average (EMA), continuing the sideways move, rather than a […]


