Trading Update: Wednesday January 15, 2025 S&P Emini market analysis Emini daily chart Emini 5-minute chart and what to expect today Yesterday’s Emini setups Al created the SP500 Emini charts. Here are reasonable stop entry setups from yesterday. I show each buy entry bar with a green arrow and each sell entry bar with a […]
DAX 40: Test Swing Target, Breakout Pullback, Possible Gap
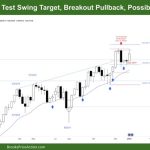
Market Video Overview: DAX 40 Futures Tim Fairweather’s weekly report on the DAX 40 futures market. Follow Tim Fairweather’s YouTube channel for more Al Brooks price action analysis. Market analysis reports archive You can access all weekend reports on the Market Analysis page.
DAX 40: Monthly Test Breakout Point, Leg 3

Market Video Overview: DAX 40 Futures Tim Fairweather’s weekly report on the DAX 40 futures market. Follow Tim Fairweather’s YouTube channel for more Al Brooks price action analysis. Market analysis reports archive You can access all weekend reports on the Market Analysis page.
Emini Breakout above All Time High
Trading Update: Thursday October 10, 2024 End of day video review Follow PriceActionRose’s YouTube channel for more Al Brooks price action analysis. S&P Emini market analysis Emini daily chart Emini 5-minute chart and what to expect today Yesterday’s Emini setups Al created the SP500 Emini charts. Here are reasonable stop entry setups from yesterday. I […]
Emini Bears Need to Do More for Downside Breakout
Trading Update: Monday September 30, 2024 End of day video review S&P Emini market analysis Emini daily chart Emini 5-minute chart and what to expect today Friday’s Emini setups Al created the SP500 Emini charts. Here are reasonable stop entry setups from Friday. I show each buy entry bar with a green arrow and each […]
Emini Closed March 8th Breakout Point
Trading Update: Wednesday April 3, 2024 S&P Emini pre-open market analysis Emini daily chart Emini 5-minute chart and what to expect today Yesterday’s Emini setups Richard created the SP500 Emini charts (Al travelling). Here are reasonable stop entry setups from yesterday. I show each buy entry bar with a green arrow and each sell entry […]
Emini Testing below March 8th Breakout Point
Trading Update: Tuesday April 2, 2024 S&P Emini pre-open market analysis Emini daily chart Emini 5-minute chart and what to expect today Yesterday’s Emini setups Richard created the SP500 Emini charts. Al travelling. Here are reasonable stop entry setups from yesterday. I show each buy entry bar with a green arrow and each sell entry […]
Emini Bulls Defending March 8 Breakout Point
Trading Update: Thursday March 28, 2024 End of day video review **End of Day Emini Review starts at 4min 30secs – Will edit later** S&P Emini pre-open market analysis Emini daily chart Emini 5-minute chart and what to expect today Emini Intra-Day Update Yesterday’s Emini setups Al created the SP500 Emini charts. Here are reasonable […]
Emini Upside Breakout Likely to Get Second Leg
Trading Update: Monday January 22, 2024 S&P Emini pre-open market analysis Emini daily chart Emini 5-minute chart and what to expect today Friday’s Emini setups Al created the SP500 Emini charts. Here are reasonable stop entry setups from Friday. I show each buy entry bar with a green arrow and each sell entry bar with […]
Emini Breakout above June High
Trading Update: Thursday July 13, 2023 S&P Emini pre-open market analysis Emini daily chart Emini 5-minute chart and what to expect today Yesterday’s Emini setups Al created the SP500 Emini charts. Here are several reasonable stop entry setups from yesterday. I show each buy entry with a green rectangle and each sell entry with a […]

