Trading Update: Thursday October 6, 2022 Emini pre-open market analysis Emini daily chart The bulls got a second leg up from the two-bar bull breakout on Monday and Tuesday. They are hoping for sideways to up likely with test of the 4,000 big round number. However more likely the market will continue sideways for now. […]
If you are not seeing the latest Weekly Report below, your PC/device browser is likely showing you an earlier page copy. Simply refresh your browser. For PCs you can use the F5 key, or Ctrl-F5, several times if needed.
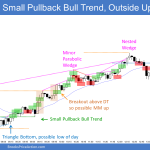
Emini Surprise Breakout Second Leg Up Likely
Trading Update: Wednesday October 5, 2022 Emini pre-open market analysis Emini daily chart The bulls have gotten a strong reversal over the past two trading days. The upside Emini surprise breakout is strong enough that the first reversal down will likely fail and lead to a second leg up. At the moment, the odds favor […]
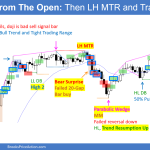
Emini Bulls Trying for Consecutive Strong Closes
Trading Update: Tuesday October 4, 2022 Emini pre-open market analysis Emini daily chart The bulls got a close above Friday’s high yesterday, and they want consecutive strong closes today. Bulls are trying to prevent the successful bear breakout below the June low. Right now, the odds favor a rally and a test back to the […]
Emini Bears Need Breakout Follow Through below June Low
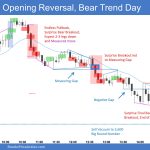
Trading Update: Monday October 3, 2022 Emini pre-open market analysis Emini daily chart The bears got a strong finish to the end of the week and month. The market closed below the June low, which is good for the bears but they need breakout follow through today. The bears have an opportunity to break far […]
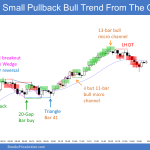
Emini Third Leg Down – Sept Close at Low
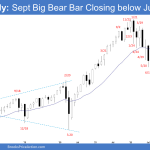
Market Overview: S&P 500 Emini Futures The S&P 500 Emini futures September candlestick closed below June low. The odds of an Emini third leg down of a larger wedge pattern have increased. Bulls want a reversal higher but need at least a strong reversal bar or a micro double bottom before they would be willing to buy […]
Crude Oil No Follow-through Selling on Weekly Chart
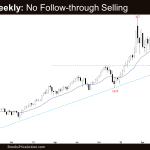
Market Overview: Crude Oil Futures The Crude oil futures continue to trade lower in a tight bear channel. However, there is a lot of overlapping price action on the weekly chart (crude oil no follow-through) which means the bears are not yet as strong as they could have been. The bears failed to get follow-through selling following […]
EURUSD Weak Bear Bar with Long Tail Below
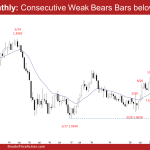
Market Overview: EURUSD Forex The EURUSD Forex monthly candlestick was another EURUSD weak bear bar after breaking below the 7-year trading range low. There is now a micro wedge (July, Aug and Sept) on the monthly chart. Bulls want a larger 2-legged sideways to up pullback before the EURUSD trades lower. The problem with the […]
Bitcoin 72% Down from All-Time Highs
Market Overview: Bitcoin Futures The Bitcoin futures end the Q3 2022 (3rd quarter of 2022) 72% down from all-time highs. During Q2 2022, the Bitcoin price experienced a large sell-off, but bears did not get good follow through selling during Q3 2022: the price closed above Q2 2022 close. The price will probably test $30000 […]
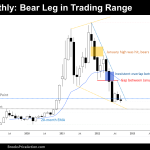
Nasdaq 100 Bear Close below June Low Support
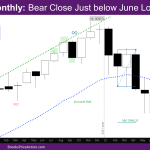
Market Overview: NASDAQ 100 Emini Futures The NASDAQ Emini futures September monthly candlestick is a bear trend bar with close below June Low support, with a tail on top. It is a good entry bar following the Low 1 sell signal bar of last month. The market closed just below the June low. By closing below […]
FTSE 100 Big Bear Bar Pause at 100-Month MA
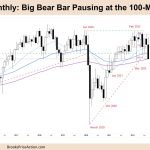
Market Overview: FTSE 100 Futures The FTSE futures market continued down last month with a big bear bar pause as traders expected after an August strong sell signal. The bulls want a moving average gap bar buy setup and the bears want another leg down. It’s a longer-term trendline break, so some traders will expect a […]

