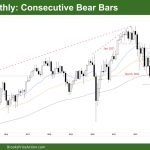
Market Overview: DAX 40 Futures DAX futures continued down this month with consecutive bear bars closing on lows. The bulls see a bull flag in a longer-term bull trend and expected the second leg to get back to near the breakout of the trading range. The bears see a tight bear channel, but with overlap […]
If you are not seeing the latest Weekly Report below, your PC/device browser is likely showing you an earlier page copy. Simply refresh your browser. For PCs you can use the F5 key, or Ctrl-F5, several times if needed.
Nifty 50 Double Top and Increased Trading Range Action
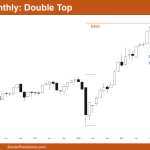
Market Overview: Nifty 50 Futures A Nifty 50 double top formed on monthly chart and showed increasing trading range price action after the breakout of the small bear channel. Market is trading in the current range for the last 10 months now. Nifty 50 on the weekly chart has filled the breakout gap, so now less […]
Emini Failing to Break below June Low, Expect Rally Soon
Trading Update: Friday September 30, 2022 Emini pre-open market analysis Emini daily chart The bears broke below the June low yesterday, however, they failed to close below it, and the market will probably reverse up, so expect rally soon. The bulls see a micro wedge bottom (9/23, 9/27, 9/29) and will try for two legs […]
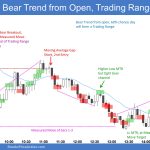
Emini Minor Reversal Up after June Low Test
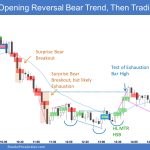
Trading Update: Thursday September 29, 2022 Emini pre-open market analysis Emini daily chart The bulls got a bull reversal bar yesterday, ending the six-bar bear micro channel streak. A minor reversal up means traders should expect more sideways than straight up. The bears will look to sell the first reversal up. They want to prevent […]
Emini Profit Taking Likely Soon
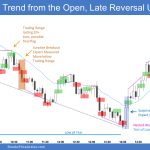
Trading Update: Wednesday September 28, 2022 Emini pre-open market analysis Emini daily chart Emini profit taking likely soon after market broke below the June 17 low yesterday and failed to close below. The market may have a minor reversal up; however, after six consecutive bear bars, the market will likely have to go a little […]
Emini Likely Reversal Up Soon
Trading Update: Tuesday September 27, 2022 Emini pre-open market analysis Emini daily chart Emini likely reversal up soon despite the Emini coming close to falling below the June low on the day-only session but going below it on the Globex session. The bears want a strong breakout below the June low and a 400-point selloff […]
Emini Bounce Likely after Test of June 17 Low
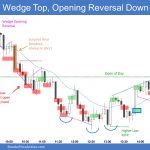
Trading Update: Monday September 26, 2022 Emini pre-open market analysis Emini daily chart The Emini had a strong selloff over last week’s final three trading days. Last Friday tested within a few points of the June 17 low. Bounce likely after test. The selloff last week was strong enough that the first reversal up will […]
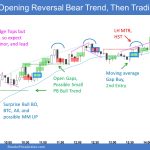
Emini Breakout below OO Pattern
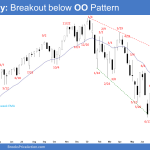
The S&P 500 Emini futures broke out below the OO (outside-outside) pattern and tested close to the June low. The June low is close enough to be a magnet. Bulls want a reversal higher from a double bottom major trend reversal. However, because of the strong sell-off, the bulls will need a strong reversal bar or at least a micro double bottom before they would be willing to buy aggressively.
Nasdaq 100 near June Low Support
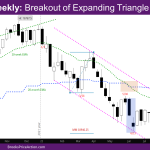
Market Overview: NASDAQ 100 Emini Futures The NASDAQ Emini futures market continued the second leg of its pullback by breaking out below the expanding triangle (ET) of the last 3 weeks and is back near June low support. The market should test below the June low to see if there are buyers or sellers. The […]
EURUSD Big Bear Breakout below Sept Low
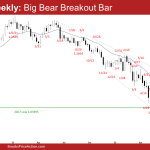
The EURUSD Forex broke out below Sept low with strength. The bears want a persistent trend down towards the year 2000 low. If the bears start getting consecutive bear bars closing near the low, the odds of this increase. The bulls will need to create strong consecutive bull bars closing near their highs to create a failed breakout soon.

