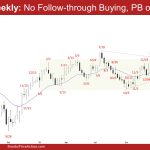
Market Overview: EURUSD Forex There was no EURUSD follow-through buying on the weekly chart. Is this simply a pullback to be followed by another leg up completing the wedge pattern (with the first two legs being February 22 and March 8), or is the market forming a lower high major trend reversal? Traders will see […]
EURUSD Two-Legged Pullback
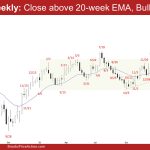
Market Overview: EURUSD Forex The weekly chart formed a EURUSD two-legged pullback, closing above the 20-week EMA. The bulls need to create a follow-through bull bar to increase the odds of the bull leg resuming. The bears want the 20-week EMA to act as resistance and a reversal from a lower high major trend reversal. […]
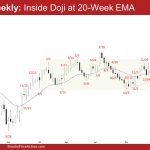
Emini Outside Doji
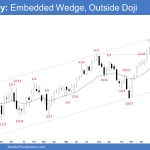
Market Overview: S&P 500 Emini Futures The weekly chart formed an Emini outside doji after making a new high. If a pullback begins, the bulls want it to be sideways and shallow, filled with bull bars, doji(s) and overlapping candlesticks. The bears want a reversal from a higher high major trend reversal and a large […]
Crude Oil ioi Pattern
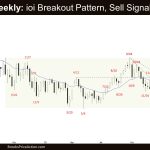
Market Overview: Crude Oil Futures The weekly chart formed a Crude Oil ioi pattern (inside-outside-inside), a breakout mode pattern. The bears want a breakout from the ioi pattern and a wedge bear flag with a strong close below the 20-week EMA. If the market trades lower, the bulls want a reversal from a higher low […]
EURUSD Doji
Market Overview: EURUSD Forex The monthly chart formed a EURUSD doji in the middle of the trading range and at the 20-month EMA. The bulls want the 20-month EMA to act as support. The bears will need to create follow-through selling below the 20-month EMA to increase the odds of a retest of the October […]
Emini Breakout
Market Overview: S&P 500 Emini Futures The monthly chart formed an Emini breakout above the prior all-time high. The bulls will need to create a follow-through bull bar in March to confirm the breakout even if it is just a bull doji. The bears will need a strong sell signal bar or a micro double […]
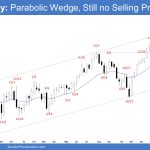
Crude Oil Wedge
Market Overview: Crude Oil Futures The monthly chart is forming a Crude Oil wedge bear flag. The bulls will need to create a follow-through bull bar closing above the 20-month EMA to increase the odds of the bull leg beginning. The bears want a retest of the December low from a wedge bear flag (Dec […]
Emini Embedded Wedge
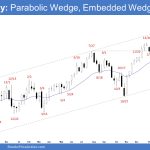
Market Overview: S&P 500 Emini Futures The weekly chart formed an Emini embedded wedge in the current leg up from January. The bulls want a strong breakout into a new all-time high territory, hoping that it will lead to many months of sideways to up trading. The bears hope to get a TBTL (Ten Bars, […]
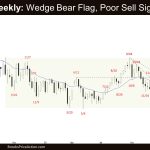
Crude Oil Wedge Bear Flag
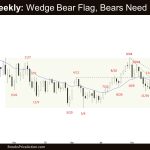
Market Overview: Crude Oil Futures The weekly chart formed a Crude Oil wedge bear flag on the weekly chart. The bears will need to create sustained follow-through selling closing below the 20-week EMA to increase the odds of another leg lower. If the market trades lower, the bulls want a reversal from a wedge bull […]
Minor Pullback on EURUSD
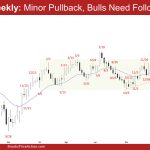
Market Overview: EURUSD Forex This week formed a minor pullback on the EURUSD weekly chart. The bulls need consecutive bull bars closing near their highs, trading above the 20-week EMA to increase the odds of the bull leg resuming. The bears want the 20-week EMA to act as resistance followed by at least a small […]