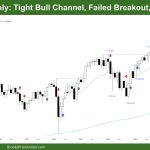
Market Overview: DAX 40 Futures DAX futures rose last month with a potential failed breakout in a bull channel. A likely parabolic wedge top, a stronger breakout on a higher time frame, and traders wonder how much of the breakout gap will stay open. Bulls are sitting on good profits, but bears haven’t triggered a […]
Nifty 50 Wedge Overshoot
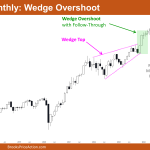
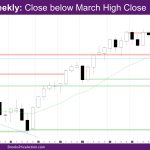
Market Overview: Nifty 50 Futures Nifty 50 Wedge Overshoot on the monthly chart. The market on the monthly chart (May month bar) gave a doji close. Bulls were able to follow through well after the wedge overshoot and are still continuing that bull leg. The weekly chart shows a very big outside bar that covered […]
Emini Sideways Likely for Bears
Trading Update: Friday June 7, 2024 S&P Emini pre-open market analysis Emini daily chart Emini 5-minute chart and what to expect today Summary of today’s S&P Emini price action Al created the SP500 Emini charts. See the weekly update for a discussion of the price action on the weekly chart and for what to expect […]
Emini Bulls Hopeful for 2nd Leg Up
Trading Update: Thursday June 6, 2024 S&P Emini pre-open market analysis Emini daily chart Emini 5-minute chart and what to expect today Summary of today’s S&P Emini price action Al created the SP500 Emini charts. End of day video review Live stream videos to follow Monday, Wednesday and Friday (subject to change). See the weekly […]
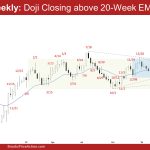
Weekly Crude Oil Tight Trading Range
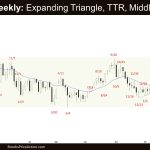
Market Overview: Crude Oil Futures The market formed a weekly Crude Oil tight trading range in the form of 4 overlapping candlesticks. The bears see the tight trading range simply as a sideways pullback and want another strong leg down. The bulls want the 20-week EMA or the bull trend line to act as support. […]
EURUSD Triangle
Market Overview: EURUSD Forex The monthly chart formed a EURUSD triangle. The bulls need to create a follow-through bull bar in June to increase the odds of higher prices. If the market trades higher, the bears want a reversal from a double top bear flag with the March 8 high. EURUSD The Monthly EURUSD Forex […]
Emini Buyers below the First Pullback
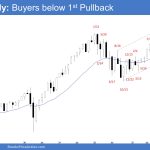
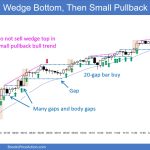
Market Overview: S&P 500 Emini Futures There were Emini buyers below the first pullback on the monthly chart. The bulls hope to get another strong leg up completing the wedge pattern with the first two legs being July 27 and March 21. The bears want a reversal from a higher high major trend reversal and a large wedge pattern (Dec 2, July 27, and March 21). S&P500 […]
Bitcoin alcistas en mensual limitan el potencial bajista
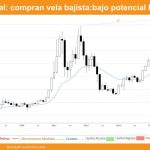
Visión del mercado El cierre mensual alcista de Bitcoin en mayo ofrece una visión fascinante de la compleja interacción entre las fuerzas alcistas y bajistas. La vela alcista, aconteciendo después del retroceso de abril, reafirma el aguante de la tendencia alcista a pesar de los fracasos anteriores para superar los máximos históricos. Sin embargo, la […]
Nasdaq 100 New High Close Just below April Month High
Market Overview: Nasdaq 100 Futures The NASDAQ Emini futures May monthly candlestick is a big bull bar with a prominent tail above. It is a new high close just below April month high. The week is a bear bar with a long tail below. The last two weeks’ reports had made the case that at least […]
Emini Bears Want 2nd Leg Down
Trading Update: Friday May 31, 2024 S&P Emini pre-open market analysis Emini daily chart Emini 5-minute chart and what to expect today Yesterday’s Emini setups Al created the SP500 Emini charts. Here are reasonable stop entry setups from yesterday. I show each buy entry bar with a green arrow and each sell entry bar with […]

