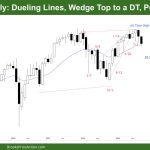
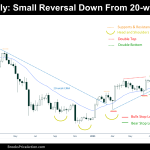
Market Overview: DAX 40 Futures DAX futures was a dueling lines pattern last month, three pushes up a wedge top to a DT. It was a weak sell signal, but triggering a sell, high in a possible TR, and after three bull pushes up, might attract bear swing sellers. Some bulls are scaling in below […]
Emini Bulls Want Test of August 18th Low
Trading Update: Friday September 29, 2023 S&P Emini pre-open market analysis Emini daily chart Emini 5-minute chart and what to expect today Emini intraday market update Yesterday’s Emini setups Al created the SP500 Emini charts. Here are several reasonable stop entry setups from yesterday. I show each buy entry with a green rectangle and each […]
Emini Buyers at 4,300 Round Number
Trading Update: Thursday September 28, 2023 S&P Emini pre-open market analysis Emini daily chart Emini 5-minute chart and what to expect today Emini intraday market update Yesterday’s Emini setups Al created the SP500 Emini charts. Here are several reasonable stop entry setups from yesterday. I show each buy entry with a green rectangle and each […]
Emini Testing 200-Day Moving Average
Trading Update: Wednesday September 27, 2023 S&P Emini pre-open market analysis Emini daily chart Emini 5-minute chart and what to expect today Yesterday’s Emini setups Al created the SP500 Emini charts. Here are several reasonable stop entry setups from yesterday. I show each buy entry with a green rectangle and each sell entry with a […]
Emini Likely to Reach August 18 Low
Trading Update: Tuesday September 26, 2023 S&P Emini pre-open market analysis Emini daily chart Emini 5-minute chart and what to expect today Yesterday’s Emini setups Al created the SP500 Emini charts. Here are several reasonable stop entry setups from yesterday. I show each buy entry with a green rectangle and each sell entry with a […]
Emini Always In Short
Trading Update: Monday September 25, 2023 S&P Emini pre-open market analysis Emini daily chart Emini 5-minute chart and what to expect today Friday’s Emini setups Al created the SP500 Emini charts. Here are several reasonable stop entry setups from Friday. I show each buy entry with a green rectangle and each sell entry with a […]
EURUSD Tight Channel
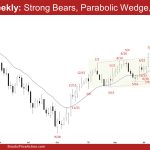
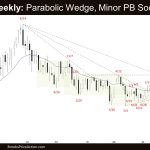
Market Overview: EURUSD Forex The weekly chart formed a EURUSD tight channel consisting of 10 consecutive bear bars. That means strong bears. Odds favor at least a small second leg sideways to down after a larger pullback. The bulls hope to get a reversal up from a parabolic wedge. EURUSD Forex market The Weekly EURUSD […]
Crude Oil Climactic Rally
Market Overview: Crude Oil Futures The weekly chart formed a Crude Oil climactic rally. While odds slightly favor the market to still be in the sideways to up phase, the move up since June has lasted a long time and is slightly climactic. A minor pullback can begin at any moment. The bears want a […]
Emini Two-legged Pullback
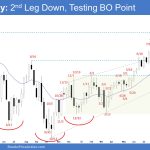
Market Overview: S&P 500 Emini Futures The weekly chart formed an Emini two-legged pullback testing near the February 2 breakout point. The bulls see the move simply as a pullback and want a retest of the July 27 high followed by a strong breakout above. The bears need to create follow-through selling following this week’s […]
Bitcoin Doble Techo y Máximo Descendente debajo de $27000
Visión de Mercado: Bitcoin Bitcoin Doble Techo y Máximo Descendente en el gráfico diario. Esta semana ha sido tranquila, el precio intentó subir pero se giró a la baja desde la Media Móvil Exponencial (MME) de 20 semanas. En el gráfico diario, el precio se encuentra dentro de una zona de venta de un Canal […]

