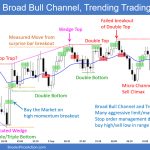
Trading Update: Friday September 8, 2023 S&P Emini pre-open market analysis Emini daily chart Emini 5-minute chart and what to expect today Yesterday’s Emini setups Richard created the SP500 Emini chart (Al travelling). Chart time is ET+12 hours. Here are several reasonable stop entry setups from yesterday. I show each buy entry with a green […]
Emini Closed August 24th Breakout Point
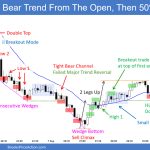
Trading Update: Thursday September 7, 2023 S&P Emini pre-open market analysis Emini daily chart Emini 5-minute chart and what to expect today Emini intraday market update Yesterday’s Emini setups Richard created the SP500 Emini charts (Al travelling). Chart time is ET+12 hours. Here are several reasonable stop entry setups from yesterday. I show each buy […]
Emini Possible 2nd Leg Trap
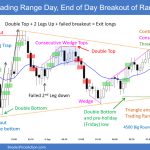
Trading Update: Wednesday September 6, 2023 S&P Emini pre-open market analysis Emini daily chart Emini 5-minute chart and what to expect today Emini intraday market update Yesterday’s Emini setups Richard created the SP500 Emini charts (Al travelling). Chart time is ET+12 hours. Here are several reasonable stop entry setups from yesterday. I show each buy […]
Emini Bulls Likely to Become Disappointed
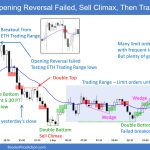
Trading Update: Tuesday September 5, 2023 S&P Emini pre-open market analysis Emini daily chart Emini 5-minute chart and what to expect today Friday’s Emini setups Richard created the SP500 Emini charts (Al travelling). Chart time is ET+12 hours. Here are several reasonable stop entry setups from Friday (before market break). I show each buy entry […]
Bitcoin Señal Bajista en Agosto
Visión de Mercados: Futuros sobre Bitcoin Bitcoin Señal Bajista en agosto. El valor de un Bitcoin ha disminuido un 11.25 % durante el mes de agosto. El gráfico mensual ha formado una señal bajista; los bajistas quieren llegar hasta el mínimo de 2022 y los alcistas esperan que haya un giro para empezar la segunda […]
Emini Breakout Test
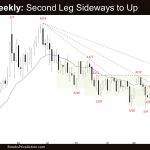
Market Overview: S&P 500 Emini Futures The monthly chart formed an Emini breakout test and a minor pullback. The bulls want a retest of the July 27 high followed by a breakout above. The next targets for the bulls are the March 2022 high and the all-time high. The bears want a reversal down from […]
Crude Oil Follow-through Buying
Market Overview: Crude Oil Futures The market formed a Crude Oil follow-through buying on the monthly chart testing the 9-month trading range high. The bulls want a breakout above and a measured move-up. The bears want a failed breakout above the trading range and the beginning of the bear leg. Crude oil futures The Monthly […]
EURUSD Strong Bears
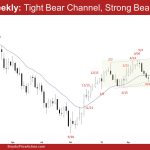
Market Overview: EURUSD Forex The weekly chart is in a tight bear channel which means EURUSD strong bears. Because of the strong move down, odds slightly favor a second leg sideways to down after a pullback. The bulls want a reversal up from a wedge bull flag. They will need to create strong bull bars […]
Nasdaq 100 First Pullback since March 2023
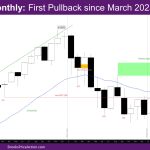
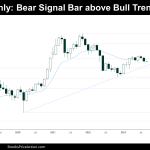
Market Overview: NASDAQ 100 Emini Futures The Nasdaq Emini futures August monthly candlestick is a doji bear bar with a big tail below. This month is the first pullback since March 2023 and the first bear body since February. The week closed as bull trend bar with small tails, closing above last week’s high. NASDAQ 100 […]
Nifty 50 Cup & Handle
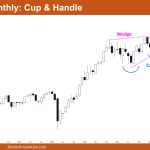
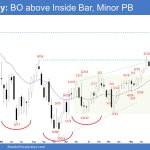
Market Overview: Nifty 50 Futures Nifty 50 Cup & Handle on the monthly chart. On the monthly chart, the market showed a bull breakout of the cup and handle pattern in the month of July, but since the market did not produce a strong follow-through bar this month, the likelihood of a failed bull breakout […]

