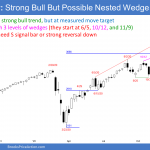
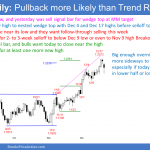
Market Overview: Weekend Market Analysis The SP500 Emini futures are at a measured move target, and there is a nested wedge top on the weekly chart. Also, the 5-week rally on the daily chart has not been very strong. Traders should expect a pullback to below 3500 to begin by early January after a possible […]
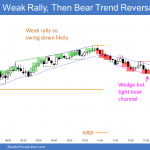
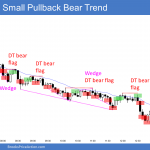
Emini momentum falling at top of December trading range
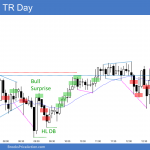
Emini and Forex Trading Update:Thursday December 24, 2020 I will update again at the end of the day. Pre-Open market analysis It is important to note that today closes at 10:15 am PST. Yesterday was a small bear reversal day on the daily chart, with Emini momentum falling, and it is a sell signal bar […]
Emini bulls want follow-through buying into the yearend
Emini and Forex Trading Update:Wednesday December 23, 2020 I will update again at the end of the day. Pre-Open market analysis The Emini formed a trading day and an inside day yesterday. It is therefore both a buy and sell signal bar, but because the Emini is in the middle of a 4-week trading range, […]
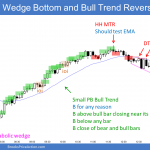
Emini formed a big High 1 buy signal bar for a possible yearend rally
Emini and Forex Trading Update:Tuesday December 22, 2020 I will update again at the end of the day. Pre-Open market analysis The Emini yesterday sold off to the bottom of the 3-week trading range and reversed up strongly. The selloff was also a test of the open of the month and last week’s low. Yesterday […]
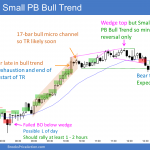
Emini breaking below its 5-week bull channel at end of the year
Emini and Forex Trading Update:Monday December 21, 2020 I will update again at the end of the day. Pre-Open market analysis The bulls want the Emini to finish the year at an all-time high. The Emini made a new all-time high on Friday, but then became an outside down bar. The bears hope that the […]
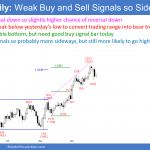
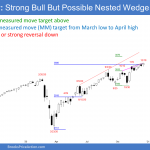
Emini risk of beginning a 10% correction into early January
Market Overview: Weekend Market Analysis The SP500 Emini futures market is rallying into the end of the year. But the bars on the daily chart are weak, and there is a nested wedge on the weekly chart. This increases the risk of a pullback to 3,500 starting by early January. The Bond futures weekly chart […]
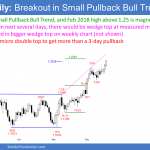
Emini has 3 legs up in December Small Pullback Bull Trend
Emini and Forex Trading Update:Friday December 18, 2020 I will update again at the end of the day. Pre-Open market analysis The Emini yesterday formed another small day that closed almost exactly where it opened. Most days for the past 7 weeks closed near the open or midpoint of the day’s range. The large number […]
Emini might form wedge top in yearend Small Pullback Bull Trend
Emini and Forex Trading Update:Thursday December 17, 2020 I will update again at the end of the day. Pre-Open market analysis The Emini yesterday closed in the middle of its range, like the majority of days since late October. The yearend Small Pullback Bull Trend bull channel that began on November 10 could continue up […]
Emini inside bar is High 1 bull flag buy signal bar for yearend rally
Emini and Forex Trading Update:Wednesday December 16, 2020 I will update again at the end of the day. Pre-Open market analysis The Emini’s low yesterday was above Monday’s low, and its high was below Monday’s high. Tuesday was therefore an Emini inside bar, an inside day. Since the Emini closed near its high, it is […]
Emini yearend tight trading range around open of the month
Emini and Forex Trading Update:Tuesday December 15, 2020 I will update again at the end of the day. Pre-Open market analysis Since yesterday was in a tight bear channel on the 5-minute Emini chart, the selloff was climactic. Therefore, day traders will expect at least a couple hours of sideways to up trading today, to […]

