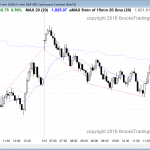
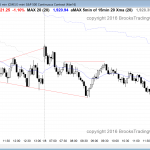
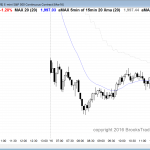
Posted 7:06 a.m. Although the day failed twice above yesterday’s high, is overbought, and quickly became Always In Short, the 1st 2 bars had bull bodies, the 1st bar was a doji, and the Emini is still in a tight bull channel. There are reasonable arguments for the bulls and bears, and some trading range […]
Intraday market update: January 13, 2016
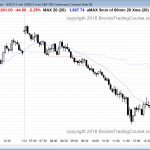
Intraday market update: January 12, 2016
Day trading tip is to expect trading range price action
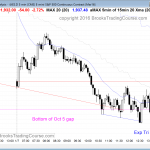
Posted 7:00 a.m. The Emini gapped up and formed a trend from the open bull trend, but the bodies were not big, the tails were prominent, and it was far above the moving average. It tested back into the October 5 gap as expected, and then tested down. This is a trading range open, and […]
Intraday market update: January 11, 2016
Learn how to trade a sell climax at support
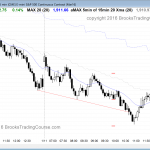
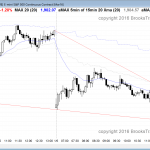
Posted 7:03 a.m. Although the Emini sold off from the open, the follow-through bars were bad. Given the context, which favors 1 – 3 days of sideways to up, and the bad follow-through down, the odds are that this initial selloff will become a bear leg in a trading range. The selloff has been strong […]
Emini weekend update: January 9, 2016:
Price action favors a pullback after a sell climax
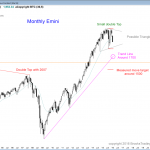
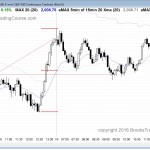
Monthly S&P500 Emini futures candlestick chart: Middle of trading range The monthly S&P500 Emini futures candlestick chart is back to the middle of the 2 year trading range and again below the moving average. The monthly S&P500 Emini futures candlestick chart has a bear trend bar for its candlestick pattern, but it is early in […]
Intraday market update: January 8, 2016
Learn how to trade after a sell climax
I will post around 6:56 a.m. The Emini triggered an expanding triangle bear flag short after the 2nd bar of the day. However, it reversed up 4 times from the bottom of the October 5 gap, and each time it did so from a lower low. The odds are that the bulls will not wait […]
Intraday market update: January 7, 2016
Price action day traders see a sell climax
Posted 6:51 a.m. The Emini reversed up strongly on the 2nd bar after testing the October 5 gap. The follow-through has been weak, but when there is an extreme sell climax on the 60 minute chart and a strong reversal up at support on the daily chart, the day is not likely to be a […]
Intraday market update: January 6, 2016
Day trading tip is to expect a trend
Posted 7:00 a.m. The Emini opened with a big gap down, but there were no bear bodies in the 1st 5 bars. This lowered the probability of bear trend day. However, there were 4 dojis. This lowered the probability of a strong bull trend day. Dojis are small trading ranges, and this open increases the […]
Intraday market update: January 5, 2016
Day trading tip is to expect more bullish price action
Posted 6:58 a.m. The Emini began with a tight trading range after yesterday’s consecutive buy climaxes. There is a 75% chance of at least a couple of hours of trading range price action beginning by the end of the 2nd hour, and it might have already begun. There is a 50% chance of follow-through buying […]
Intraday market update: January 4, 2016
Big gap down for Emini day traders
Posted 7:00 a.m. The Emini dipped below the December 17 higher low and found buyers. The bulls want a 60 minute double bottom higher low major trend reversal. The location at the bottom of a 3 month trading range is good for the bulls, as was the reversal up after the failed bear breakout. The […]
Emini weekend update: January 2, 2016:
Learn how to trade breakout mode price action
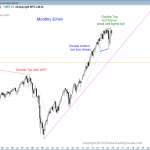
Monthly S&P500 Emini futures candlestick chart: Learn how to trade breakout mode price action The monthly S&P500 Emini futures candlestick chart has both a double top and a double bottom after a buy climax. The monthly S&P500 Emini futures candlestick chart held above its monthly moving average for 38 months, which has happened only twice […]

