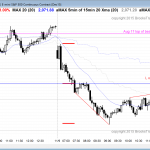
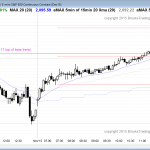
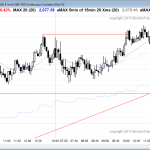
Posted 7:24 a.m. After a brief bull trap on the open, the Emini sold off, but the big bear bars were followed by bull bars. This is more common when a selloff is a bear leg in what will become a trading range. The bulls see the open as a sell climax and a parabolic […]
Intraday market update: November 9, 2015
Emini weekend update: November 7, 2015:
Learn how to trade consecutive buy climaxes
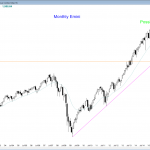
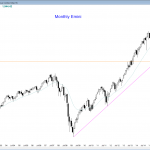
Monthly S&P500 Emini futures candlestick chart: Possible double top The monthly S&P500 Emini futures candlestick chart is forming a possible double top. The monthly S&P500 Emini futures candlestick chart reversed up strongly from its moving average in October, but the signal bar was a doji. This increased the chances that the rally will be part […]
Intraday market update: November 6, 2015
Learn how to trade price action after a report
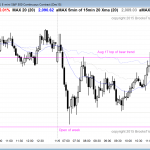
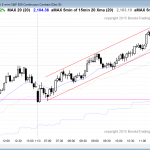
Posted 6:58 a.m. The Emini formed a 17 point tall doji bar after the report this morning, and then traded sideways. Yesterday was a triangle, and today opened within the triangle and the 1st 2 bars had prominent tails. This is trading range price action, and it reduces the chances that the bulls reach a […]
Intraday market update: November 5, 2015
Learn how to trade before a catalyst
Posted 7:15 a.m. Today began with a limit order open. Yesterday ended with a high low major trend reversal. The bulls wanted a rally on the open. There are nested wedge tops on the 5 and 60 minute charts. The bears see yesterday as the first leg down. Yesterday’s low is an entry for a […]
Intraday market update: November 4, 2015
Learn how to trade at an all-time high
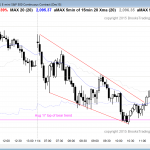
Posted 7:01 a.m. The Emini sold off on the open. It failed to rally above the resistance of the all-time high. There are extreme buy climaxes on the 60 minute and daily charts. The bulls hope to get to a new all-time high today, but the trend from the open bear trend make that unlikely. […]
Intraday market update: November 3, 2015
Learn how to trade exhaustion
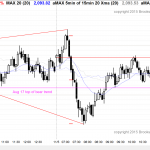
Posted 7:15 a.m. The Emini began with a reversal down and a reversal up in a narrow range at the support of level of the August 17 high (top of the bear trend). This was a Breakout Mode setup, and it often leads to a trading range that lasts 2 or more hours. The target […]
Intraday market update: November 2, 2015
Learn how to trade a climax pullback
Posted 7:15 a.m. The Emini opened with a trend from the open bull trend, but the bull breakout bars had bad follow-through. That increased the chances that the rally was a bull leg in what would become a trading range. There was a parabolic wedge top just after 7 a.m. This increased the odds for […]
Emini weekend update: October 31, 2015:
Traders learning how to trade should not buy a buy climax
Monthly S&P500 Emini futures candlestick chart: Bulls need follow-through in November The monthly S&P500 Emini futures candlestick chart reversed the August sell-off, but needs follow-through buying. Otherwise, the trading range will continue. The monthly S&P500 Emini futures candlestick chart rallied strongly in October and reversed almost all of the August selloff. There was a 20 […]
Intraday market update: October 30, 2015
Learn how to trade a buy vacuum test of resistance
Posted 7:13 a.m. The day began with a trend from the open bear trend, but the bars had big tails and were in the middle of yesterday’s trading range. Also, bulls were able to make money repeatedly by buying below bars and scalping. That combination made the initial selloff more likely a bear leg in […]
Intraday market update: October 29, 2015
Learn how to trade a pullback after a buy climax
Posted 7:22 a.m. The Emini opened with a gap down to the moving average, but the opening reversal up lacked consecutive big bull bars closing on their highs. The rally was more likely a bull leg in a developing trading range. Although the Emini is Always In Long, there is a 75% chance of at […]

