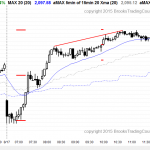
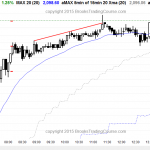
Posted 7:19 a.m. Today sold off below yesterday’s low on the open, but had bad follow-through. The bulls tried to create an expanding triangle bottom for a possible low of the day, and the bears wanted a strong breakout below yesterday’s low for a test of the 2068 area, which is the bottom of the […]
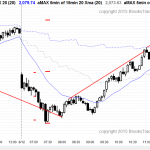
Intraday market update: August 17, 2015
Emini weekend update: August 15, 2015:
Learn how to trade futures when there is a wedge bull flag
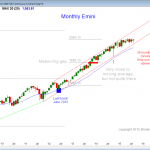
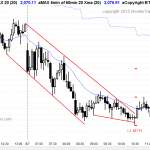
Monthly S&P500 Emini futures candlestick chart: Breakout will be soon The monthly S&P500 Emini futures candlestick chart remains in its 7 month tight trading range. The monthly S&P500 Emini futures candlestick chart will probably breakout within the next few months. It has an 80% chance of a bear breakout and a test of the monthly […]
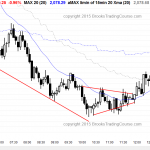
Intraday market update: August 14, 2015
Learn how to trade online in a pullback
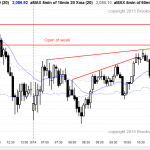
Posted 7:19 a.m. The Emini had 6 bull bodies in the 1st 6 bars, but it could not create consecutive strong bull bars, and the rally was still in the middle of yesterday’s trading range. This is trading range price action, even though it was bullish enough to make the Emini Always In Long. Because […]
Intraday market update: August 13, 2015
Learn how to trade futures after a rally
Posted 7:47 a.m. The Emini tested yesterday’s high on the open, and could not get above it. This is similar to July 8, which also followed a huge bull day. Day traders have to be aware that yesterday was a big day, and today might try to be an inside day, which means an early […]
Intraday market update: August 12, 2015
Learn how to trade legs in a trading range
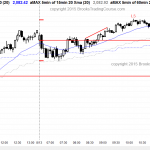
Posted 7:24 a.m. The Emini opened with a big gap down to around the bottom of the 60 minute trading range, and it then entered a bear channel where the follow-through was bad for the first 7 bars. This increased the chances that the selloff will evolve into a trading range within the couple of […]
Intraday market update: August 11, 2015
Candlestick analysis after a gap down
Posted 7:16 a.m. The Emini began with overlapping bars and many reversals. This increases the chances of a trading range day, which was already likely. The Emini is in breakout mode. Traders are looking for a breakout with good follow-through in either direction, and then they will expect at least a measured move, based on […]
Intraday market update: August 10, 2015
Intraday trading strategies when there is a gap up
Posted 7:22 a.m. The Emini had a strong bull bar on the open and then a trend from the open bull trend, but the follow-through after the 1st bar was bad. This increased the chances of a sideways to down pullback to get closer to the moving average. However, when there is a gap up […]
Emini weekend update: August 8, 2015:
Price action trading strategy is to expect a rally
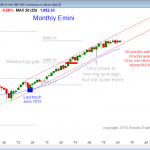
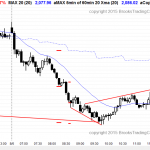
Monthly S&P500 Emini futures candlestick chart: Tight trading range, expect breakout soon The monthly S&P500 Emini futures candlestick chart is in a tight trading range and it will have an breakout up or down soon. The monthly S&P500 Emini futures candlestick chart has not touched its 20 month exponential moving average in 38 months. Using this as […]
Emini market update: August 7, 2015
How to trade online when the market is oversold
Posted 7:50 a.m. The Emini opened with big bars and many reversals, creating a big tight trading range. Risk was big and probability was low, and traders were entering with limit orders, betting breakouts would fail. They were selling above bars and buying below, and scalping. The Emini was oscillating below the moving average and […]
Emini market update: August 6, 2015
Learn how to trade futures in a trading range
I will post around 7:24 a.m. The Emini began with a trend from the open bear trend. The bulls hope that the selloff will lead to an early low of the day. There is a 2 day wedge bull flag, a parabolic wedge, and an expanding triangle. However, after 7 bars without a pullback, the […]

