Trading Update: Tuesday November 5, 2024 Emini end of day video review Follow Joseph’s YouTube channel for more Al Brooks price action analysis. S&P Emini market analysis Emini daily chart Emini 5-minute chart and what to expect today Yesterday’s Emini setups Al created the SP500 Emini charts. Here are reasonable stop entry setups from yesterday. […]
Emini Weak Inside Bar
Trading Update: Monday November 4, 2024 Emini end of day video review Follow Joseph’s YouTube channel for more Al Brooks price action analysis. S&P Emini market analysis Emini daily chart Emini 5-minute chart and what to expect today Friday’s Emini setups Al created the SP500 Emini charts. Here are reasonable stop entry setups from Friday. […]
Bitcoin octubre roza el máximo histórico
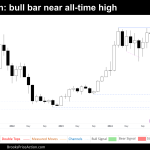
Visión del mercado Esta semana, la vela mensual de octubre cerró como una barra alcista que casi alcanzó el máximo histórico anterior de Bitcoin. El cierre mensual, posicionado por encima del máximo de septiembre, sugiere que noviembre o diciembre podrían traer un nuevo intento de probar el máximo de octubre. Reflexionando sobre el año hasta […]
Monthly Emini Reversal Bar
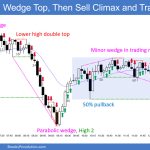
Market Overview: S&P 500 Emini Futures The market formed a monthly Emini reversal bar in October. The bears want a reversal from a wedge (Mar 21, Jul 16 and Oct 17) and an embedded wedge (Mar 21, Jul 16 and Oct 17). To increase the odds of a deeper pullback, they must create a strong […]
Overlapping Candlesticks in Crude Oil
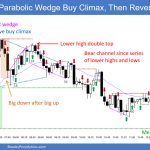
Market Overview: Crude Oil Futures The overlapping candlesticks in Crude Oil, poor follow-through and frequent reversals are hallmarks of trading range price action. The bears hope to get a second leg sideways to down to retest the September low followed by a breakout below the triangle. The bulls want a reversal from a double bottom […]
Monthly EURUSD Pullback
Market Overview: EURUSD Forex The market formed a monthly EURUSD pullback to the middle of the trading range. The bulls see the current move as a pullback and a retest of the breakout point. They want the bull trend line or the 20-month EMA to act as support followed by a retest of the recent […]
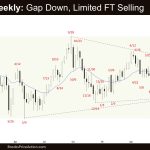
FTSE 100: Monthly Bear Outside Down at Moving Average

Market Video Overview: FTSE 100 Futures Tim Fairweather’s weekly report on the FTSE 100 futures market. Follow Tim Fairweather’s YouTube channel for more Al Brooks price action analysis. Market analysis reports archive You can access all weekend reports on the Market Analysis page.
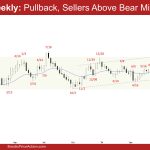
DAX 40: Monthly Test Breakout Point, Leg 3

Market Video Overview: DAX 40 Futures Tim Fairweather’s weekly report on the DAX 40 futures market. Follow Tim Fairweather’s YouTube channel for more Al Brooks price action analysis. Market analysis reports archive You can access all weekend reports on the Market Analysis page.
Nasdaq 100 L2 Sell Signal Bar That Will Likely Trigger
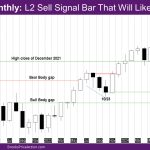
Market Overview: NASDAQ 100 Emini Futures The NASDAQ Emini futures October monthly candlestick is a bear doji bar with a longer tail above. It is an L2 sell signal bar that will likely trigger. The week is an outside down bear bar with tails above and below. It went above the high of last week and […]
Nifty 50 Tight Bull Channel
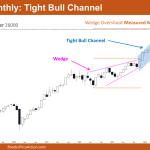
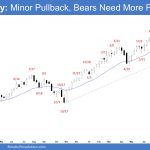
Market Overview: Nifty 50 Futures Nifty 50 Tight Bull Channel on the monthly chart. Nifty 50 is currently in a tight bull channel on the monthly chart. This month, the market showed a strong bearish close for the first time in a year. Despite the prevailing strong bull trend, bears will need consistent follow-through bars […]

