Trading Update: Friday July 29, 2022 Emini pre-open market analysis Emini daily chart The bulls got follow-through after the July 27 breakout. This increases the odds that the market will reach the June 2 high soon, which is the last major lower high. The bulls are trying to change the character of market and want […]
Emini bulls need follow-through test of June 2 lower high
Trading Update: Thursday July 28, 2022 Emini pre-open market analysis Emini daily chart The bulls got a bull breakout closing above the July 22 high yesterday. Bulls want this breakout to have a follow-through test today reaching the June 2nd major lower high. There is a measured move projection from the July 14 low to […]
Emini likely to test July 21 close soon
Trading Update: Wednesday July 27, 2022 Emini pre-open market analysis Emini daily chart Bears ended the 8-bar bull micro channel yesterday and got a bear bar closing near its low and below the open of June 28. July 21 was a reasonable Buy The Close bar, so the market with Emini likely to test July […]
Emini bears want close below breakout point (June 28)
Trading Update: Tuesday July 26, 2022 Emini pre-open market analysis Emini daily chart Emini bears want close below breakout point of June 28, damaging the bull case. The market formed an inside bar yesterday, closing near the open of the bar. Bulls hope that yesterday will lead to a successful pullback (high 1) buy setup […]
Emini bulls want breakout to reach June high
Trading Update: Monday July 25, 2022 Emini pre-open market analysis Emini daily chart The bulls broke above the neckline (June 28) of the double bottom (July 14) last week. Bulls want breakout to lead to a measured move up and test of the June 2nd major low or high. The measured move from the July […]
Bitcoin retroceso en el soporte principal
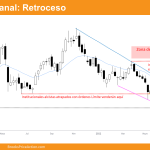
Visión general del mercado: Futuros de Bitcoin El retroceso de Bitcoin es una realidad después de que el precio se estrellara contra un Soporte Mayor de Mercado. Los Traders esperan que el precio alcance los 28800 $ durante los próximos meses. Futuros del Bitcoin Gráfico Semanal de los Futuros del Bitcoin Los Traders todavía piensan que la […]
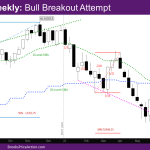
EURUSD sideways at wedge bottom pullback
The EURUSD Forex broke below the 2017 low with follow-through selling recently. The bulls want a reversal higher from a wedge bottom (Mar 4, May 13 and July 14) and a trend channel line overshoot. However, the move down is in a tight bear channel. That means strong bears. Odds slightly favor lower prices for the EURUSD after a larger pullback.
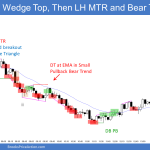
Nasdaq 100 bull breakout attempt
Market Overview: NASDAQ 100 Emini Futures NASDAQ 100 bull breakout attempt above the tight trading range (TTR) that has been going on for the last 4 weeks. The week closed with a bull body, but a big tail at the top and bottom. We have been saying for a couple of weeks now that prices […]
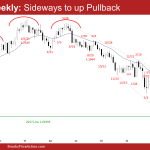
Emini second leg sideways to up pullback
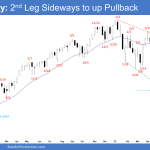
The S&P 500 Emini futures traded higher from a higher low major trend reversal. Bulls need to create a consecutive bull bar (follow-through buying) next week, something they have failed to do since March. The bear trend line and 20-week exponential moving average remain resistances above. If next week closes as a bear bar instead, it will mean the bulls failed to get follow-through buying yet again. Odds of a re-test of June low increases.
Nifty 50 futures micro channel
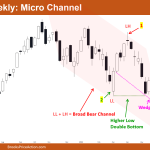
Market Overview: Nifty 50 Futures Nifty 50 futures micro channel on weekly chart with strong bull close, but near a major swing high, so high probability of Double Top attempt in the coming week. Overall market structure on weekly chart is broad bear channel, so you can always buy low and sell high (broad channels […]

