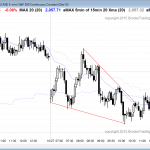
Posted 7:27 a.m. The Emini gapped down and formed a 2 day island top. It reversed up from above the bottom of Friday’s gap up. The reversal was at the 60 minute moving average. The rally was a trend from the open bull trend and it closed today’s gap down by going above yesterday’s low, […]
Intraday market update: October 27, 2015
Intraday market update: October 26, 2015
Learn how to trade the markets when exhausted
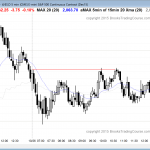
Problems with the server so 7:12 update was lost. I wrote that the Emini was in a bear swing in a probable trading range day, and that it would probably have swings up and down, each lasting at least a couple of hours. Pre-Open Market Analysis S&P 500 Emini: Learn how to trade the markets […]
Ask Al: What trading drawdowns to expect

BPA trading room Q&A: October 6, 2015 What kind of drawdowns should a trader expect at different stages of their development? Audio duration: 7min 09sec — Scroll down for chart references at end Audio transcript Trading drawdowns — Your risk on any one trade Well, obviously that’s very open-ended and there’s so many variables, […]
Emini weekend update: October 24, 2015:
Those who trade the markets for a living see buy climaxes
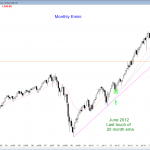
Monthly S&P500 Emini futures candlestick chart: Breakout above 2 month bull flag The monthly S&P500 Emini futures candlestick chart is reversing up strongly from the 1st pullback to the moving average in 38 months. The monthly S&P500 Emini futures candlestick chart is forming a strong entry bar above last month’s weak buy signal bar. The 1st […]
Intraday market update: October 23, 2015
Learn how to trade a buy climax
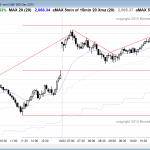
Posted 7:00 a.m. The bulls got some follow-through buying on the open, but the Emini is extremely far above the moving average. Whenever the market does something extreme, it is in a climax. A climax can last a long time before the bulls take profits, but it is then usually followed by a sideways to […]
Intraday market update: October 22, 2015
Learn how to trade the markets when a pullback as it unfolds
Posted 7:22 a.m. The bulls got a trend from the open bull trend and then began to form dojis. That is a sign that it is probably entering a tight trading range, and that it might be sideways for 2 or more hours. If so, the bulls will try for trend resumption up later in […]
Intraday market update: October 21, 2015
Learn how to trade an overbought trend
Posted 7:15 a.m. The Emini opened with a limit order market just below yesterday’s high, and reversed down from a micro double top. Because the few big bull days of the past 3 weeks have had only small tails below and today’s selloff is already 9 points below the open, today will probably not be […]
Intraday market update: October 20, 2015
Learn how to trade a wedge top
Posted 7:26 a.m. Today’s open was similar to yesterday’s, except that yesterday had strong bulls on the day before. It is a limit order open, and it increases the chances for more trading range price action today, especially after 2 trading range days. A strong trend can come at any time, but traders need to […]
Intraday market update: October 19, 2015
learn how to trade a candlestick pattern: expanding triangle bear flag
Posted 7:08 a.m. The Emini reversed up from above yesterday’s low with 4 bull trend bars closing above their midpoints. It is testing near the top of Friday’s trading range. Because Friday was a trading range day, the odds of a trading range day today are higher. While it is possible that this initial rally […]
Ask Al: Second leg traps in trading ranges (USDJPY)
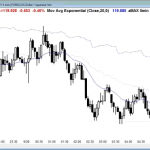
BPA trading room Q&A: September 28, 2015 I had a situation this morning at 09:00 EDT (06:00 PDT), on the 5 minute Dollar versus Yen Forex chart. It was late in the bear trend, price formed a trading range and a higher low… we had a bull breakout, but a lower high, and at the […]


