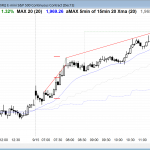
Posted 7:29 a.m. The bears got 4 consecutive bars on the open and then a lower high, but the bulls got a strong reversal up from just above the moving average. The bears saw this as a double top. When that happens, the bulls hope that any selloff will result in a double bottom and […]
Intraday market update: September 15, 2015
Intraday market update: September 14, 2015
How to trade online when the price action is sideways
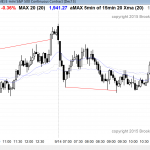
Posted 7:15 a.m. The Emini reversed down from yesterday’s wedge top and fell for 4 consecutive bars. It was Always In Short, but at the apex of a tight 60 minute triangle and at all 3 moving averages, which are flat. This is a bear leg within a trading range, and it is less likely […]
Ask Al: V-bottoms, gaps, and climaxes
BPA trading room Q&A: February 26, 2015 I sold Crude Oil at 11:30. Since V-bottoms do not exist. I thought a test of the low, or at least the trading range, a higher probability. Would you explain why V-bottoms do not exist? Video duration: 4min 28sec Video transcript V-bottoms not what you may think V-bottoms […]
Emini weekend update: September 12, 2015:
Traders learning how to trade the markets see a pullback in bear trend
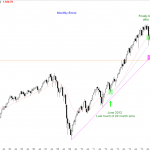
Monthly S&P500 Emini futures candlestick chart: Pullback in bull trend The monthly S&P500 Emini futures candlestick chart is holding support at the 20 month moving average The monthly S&P500 Emini futures candlestick chart finally pulled back to its moving average after 38 months above the average. It found buyers there. Since 38 months is extreme, […]
Intraday market update: September 11, 2015
Learn how to trade the markets when the price action is sideways
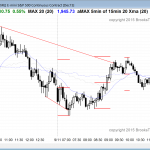
Posted 7:15 a.m. The Emini continued its broad bear channel from yesterday, but a broad channel with a wedge shape has about a 75% chance of a bull breakout. The bull breakout can be followed by a trading range or a swing up. There is a 25% chance of a strong bear breakout and then […]
Intraday market update: September 10, 2015
Learn how to trade futures when there are climactic reversals
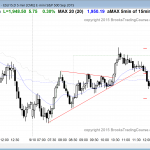
Posted 7:37 a.m. Yesterday had a reasonable bottom attempt before the collapse into the close. There were theoretical scale in bulls who were buying near yesterday’s low, expecting a test back up to that trading range, just above the 60 minute moving average. The bears needed a strong breakout below yesterday’s low to make the […]
Intraday market update: September 9, 2015
Price action trading strategies in a buy climax
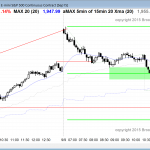
Posted 7:29 a.m. The Emini had a trend from the open bear trend at the top of the 5 and 60 minute channel and below the 1991 lower high. The selloff had reasonable follow-through after each big bear bar and the Emini is Always In Short. There is a 70% chance that we have seen […]
Intraday market update: September 8, 2015
Day trading tip is to expect bullish price action today or tomorrow
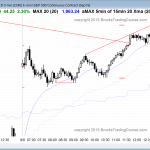
Posted 7:23 a.m. The Emini opened with a big gap up, but quickly sold off to a new low and it had trading range price action. Although today can still be a trend day, and the Emini is close to the bear trend line above, this type of price action increases the chances that today […]
Ask Al: How long to get profitable following trading room?
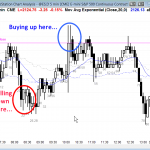
BPA trading room Q&A: May 22, 2015 You said it would take about two years to become profitable after taking your trading course. What about if we only take your trade recommendations in this trading room webinar? Audio duration: 8min 15sec Audio transcript Can I learn to trade profitably in 2 years? Actually, I […]
Emini weekend update: September 5, 2015:
Candlestick pattern is a head and shoulders top
Monthly S&P500 Emini futures candlestick chart: More sideways to down likely The monthly S&P500 Emini futures candlestick chart finally pulled back to the moving average after 38 months above it. The monthly S&P500 Emini futures candlestick chart pulled back to the moving average after an extreme buy climax. The two prior times in the past 50 […]


