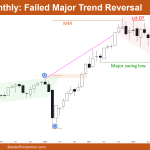
Market Overview: Nifty 50 Futures Nifty 50 failed major trend reversal on the monthly chart. Bears tried to reverse the bull trend by selling lower high double top, but failed to cause a reversal. Rather bulls are now trying to resume the bull trend, by forming consecutive bull bars closing near their high. Nifty 50 […]
Emini possibly sideways trading range soon
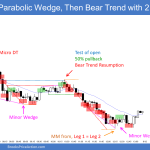
Trading Update: Friday August 12, 2022 Emini pre-open market analysis Emini daily chart Emini possibly sideways trading range soon. The market broke above the midpoint of the year (4,220) and closed near its low yesterday. While the market is in a small pullback bull trend, the odds favor the market forming a trading range soon […]
FTSE 100 consecutive bear bars low in trading range
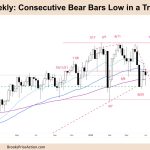
Market Overview: FTSE 100 Futures The FTSE futures market moved lower again last week with FTSE 100 consecutive bear bars low in a trading range. We are back at the October 2021 breakout point and it makes you wonder if this is a failed breakout above the high. With bulls unwilling to buy they might need […]
Bitcoin 2.ª Bear Leg en Trading Range
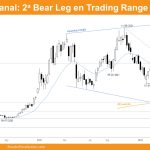
Visión general del mercado: Futuros del Bitcoin Los Futuros sobre Bitcoin están desarrollando una 2.ª Bear Leg (pata bajista) dentro de un Bear Channel (canal bajista), tras venir cayendo un 70 % desde máximos, actualmente realizando un test a un soporte mayor de mercado: el previo Breakout Point (punto de ruptura), que además es el […]
EURUSD sideways trading range for 9 weeks
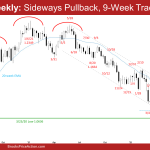
The EURUSD Forex is in a 9-weeks sideways trading range. The bulls want a reversal from a double bottom (May 13 and Jun 15) following a trend channel line overshoot and a wedge bottom (Aug 20, Nov 24 and May 13). They need to create follow-through buying next week to convince traders that a reversal higher may be underway. The bears want the EURUSD to stall around or below the May 20 high, the bear trend line, or the 20-week exponential moving average and a re-test of the low.
Nasdaq trading range bear bar closing below May low
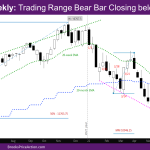
Market Overview: NASDAQ 100 Emini Futures Nasdaq trading range bear bar candlestick closing below last week’s low, but with tails above and below. The week opened at the May low and closed lower for the 1st two days of the week. Wednesday was a trading range day but with bull body in the middle, which means […]
FTSE Always in Short at bottom of trading range
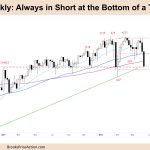
Market Overview: FTSE 100 Futures FTSE always in short at the bottom of a trading range. It could be a sell climax down to the big round number of 7000. The bulls see we are at the bottom of a trading range and will look to scale in short. The bears see we broke down […]
Nifty 50 futures strong bear close after double bottom
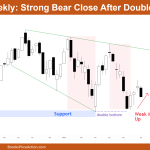
Market Overview: Nifty 50 Futures The Nifty 50 futures have given strong bear close after double bottom, but the best bears can get would be a trading range, so bulls would be again looking to buy near the trading range bottom. Nifty 50 on the daily chart is in a broad bear channel which are always a […]
FTSE 100 bull doji high in trading range
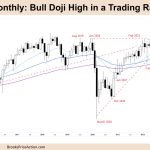
Market Overview: FTSE 100 Futures The FTSE futures market was a bull doji high in a trading range. Limit order traders have been making money on the higher timeframes and until they stop doing so we will go sideways. On the weekly timeframe stop entry traders can make money if they buy low sell high and […]
Nifty 50 futures increasing trading range price action
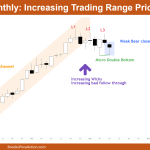
Market Overview: Nifty 50 Futures The Nifty 50 futures after giving a breakdown of bull micro channel on monthly chart now showing increasing trading range price action, and also forming micro double bottom after a Low 3. Nifty 50 on the weekly chart came to support area but weak reversal up without bull strength, which was clearly […]

