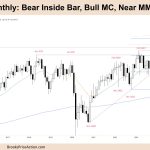
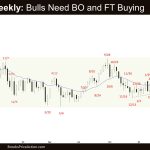
Market Overview: FTSE 100 Futures FTSE 100 futures went sideways last month with a bear inside bar high. The pullback hasn’t appeared on this time frame yet, so it’s still always in long, and the first reversal is likely to be minor. Weekly bears are trying to close gaps below, but its more likely profit-taking […]
Emini Bears Want Reversal Bar Today
Trading Update: Friday June 28, 2024 S&P Emini pre-open market analysis Emini daily chart Emini 5-minute chart and what to expect today Yesterday’s Emini setups Al created the SP500 Emini charts. Here are reasonable stop entry setups from yesterday. I show each buy entry bar with a green arrow and each sell entry bar with […]
Emini Sellers Likely Above
Trading Update: Thursday June 27, 2024 S&P Emini pre-open market analysis Emini daily chart Emini 5-minute chart and what to expect today Yesterday’s Emini setups Al created the SP500 Emini charts. Here are reasonable stop entry setups from yesterday. I show each buy entry bar with a green arrow and each sell entry bar with […]
Emini Bad Buy Signal Bar for Bulls
Trading Update: Wednesday June 26, 2024 S&P Emini pre-open market analysis Emini daily chart Emini 5-minute chart and what to expect today Yesterday’s Emini setups Al created the SP500 Emini charts. Here are reasonable stop entry setups from yesterday. I show each buy entry bar with a green arrow and each sell entry bar with […]
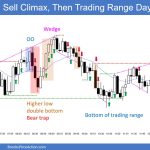
Emini Daily Chart Transitioning into Trading Range
Trading Update: Tuesday June 25, 2024 S&P Emini pre-open market analysis Emini daily chart Emini 5-minute chart and what to expect today Emini Intra-Day Update Yesterday’s Emini setups Al created the SP500 Emini charts. Here are reasonable stop entry setups from yesterday. I show each buy entry bar with a green arrow and each sell […]
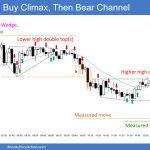
Emini Support at 5,500 Round Number
Trading Update: Monday June 24, 2024 S&P Emini pre-open market analysis Emini daily chart Emini 5-minute chart and what to expect today Emini Intra-Day Update Friday’s Emini setups Al created the SP500 Emini charts. Here are reasonable stop entry setups from Friday. I show each buy entry bar with a green arrow and each sell […]
EURUSD Bear Leg
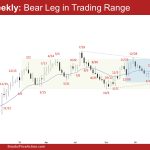
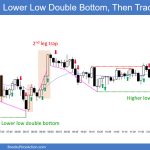
The weekly chart is still in a EURUSD bear leg. The bears need to continue creating follow-through selling to increase the odds of a breakout below the bull trend line. The bulls want a reversal from a higher low major trend reversal and a wedge bull flag (Feb 14, Apr 16, and Jun 14). If […]
Bitcoin bear follow through after double top and pointing towards $60000
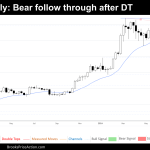
Market overview In this week’s Bitcoin report, we delve into the evolving market dynamics as Bitcoin navigates a critical juncture. The weekly chart showcases a potential shift in short-term momentum, as bearish signals emerge amidst a broader bullish structure. We maintain a cautious outlook for the coming weeks, anticipating sideways to downward trading unless a […]
Crude Oil Bulls Need Follow-through
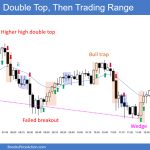
Market Overview: Crude Oil Futures The Crude Oil bulls need follow-through buying following this week’s breakout above the bear trend line. They also need to create a breakout above the expanding triangle top. The bears want a reversal from a lower high major trend reversal, from a double top bear flag (May 29 and Jun […]
Emini Micro Wedge
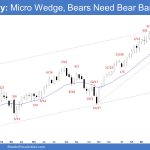
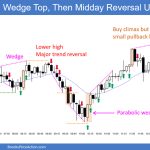
Market Overview: S&P 500 Emini Futures The weekly chart formed an Emini micro wedge (Jun 7, Jun 12, and Jun 21). The problem with the bear’s case is that they have not been able to create strong bear bars with sustained follow-through selling. The bears need to create a strong entry bar with follow-through selling […]

