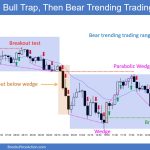
Market Overview: Crude Oil Futures The Crude Oil bulls need follow-through buying following this week’s breakout above the bear trend line. They also need to create a breakout above the expanding triangle top. The bears want a reversal from a lower high major trend reversal, from a double top bear flag (May 29 and Jun […]
Emini Micro Wedge
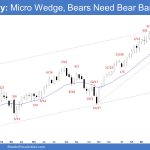
Market Overview: S&P 500 Emini Futures The weekly chart formed an Emini micro wedge (Jun 7, Jun 12, and Jun 21). The problem with the bear’s case is that they have not been able to create strong bear bars with sustained follow-through selling. The bears need to create a strong entry bar with follow-through selling […]
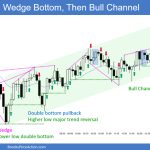
Nifty 50 Bull Channel
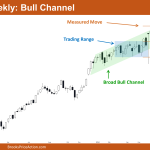
Market Overview: Nifty 50 Futures Nifty 50 Bull Channel on the weekly chart. The market on the weekly chart closed with a bearish candlestick. The bear bar has a small body with small tails on either side. The market is trading near the top of the bull channel, and this week it nearly reached the […]
Nasdaq 100 Bad Follow-Through to Biggest Bull Body Since October
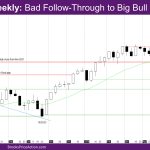
Market Overview: NASDAQ 100 Emini Futures The NASDAQ Emini futures week is a doji bull bar with a long tail above. It is another new all-time high close above June 10 high, but a bad follow-through to biggest bull body since October. On the daily chart, the market made the measured-move target mentioned in the […]
DAX 40 Bull Channel, Bottom ⅓ TR, 18000 Magnet
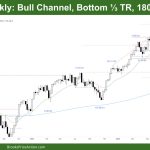
Market Overview: DAX 40 Futures DAX futures went higher last week with a small bull bar at the 18000 magnet. It’s a pullback and a pause after a big volatility expansion last week. Always in short on the daily chart and lower third of a trading range on the weekly, so probably buyers not far […]
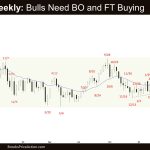
FTSE 100 Breakout, Two Legs Sideways to Down, High 2
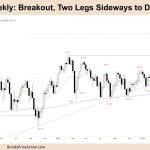
Market Overview: FTSE 100 Futures FTSE 100 futures went higher last week, reversing the week before. Two legs down after a very strong breakout. The bears want a third leg, but with the daily chart going always in long, it would be better to be long or flat next week. It can go sideways, but […]
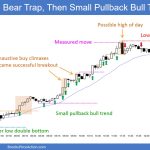
Emini Bears Halting Buying Pressure
Trading Update: Friday June 21, 2024 S&P Emini pre-open market analysis Emini daily chart Emini 5-minute chart and what to expect today Emini Intra-Day Update Yesterday’s Emini setups Al created the SP500 Emini charts. Here are reasonable stop entry setups from yesterday. I show each buy entry bar with a green arrow and each sell […]
Emini Pullback to Moving Average Likely
Trading Update: Thursday June 20, 2024 End of day video review S&P Emini pre-open market analysis Emini daily chart Emini 5-minute chart and what to expect today Tuesday’s Emini setups Al created the SP500 Emini charts. Here are reasonable stop entry setups from Tuesday (before yesterday’s US holiday break). I show each buy entry bar […]
Emini Consecutive Buy Climaxes on Daily Chart
Trading Update: Tuesday June 18, 2024 S&P Emini pre-open market analysis Emini daily chart Emini 5-minute chart and what to expect today= Yesterday’s Emini setups Al created the SP500 Emini charts. Here are reasonable stop entry setups from yesterday. I show each buy entry bar with a green arrow and each sell entry bar with […]
Emini Weak High 1 Buy Signal Bar
Trading Update: Monday June 17, 2024 S&P Emini pre-open market analysis Emini daily chart Emini 5-minute chart and what to expect today Friday’s Emini setups Al created the SP500 Emini charts. Here are reasonable stop entry setups from Friday. I show each buy entry bar with a green arrow and each sell entry bar with […]

