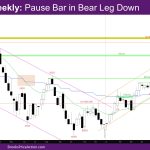
Market Overview: NASDAQ 100 Emini Futures The NASDAQ Emini futures week is a bull doji bar with a long tail above. It is a pause bar in bear leg down since July 31. The market also went above the high of the prior week and then sold off. The August monthly bar is a bear […]
DAX 40 Pullback After AIS or Wedge Bull Flag? TR
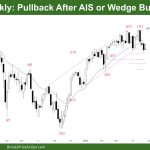
Market Overview: DAX 40 Futures DAX futures moved sideways last week with a pullback after potentially going always in short. Most traders will wait to see if there is a second leg they can participate in or wait for a buy signal low in a TR. Bulls will still get a MA Gap bar buy […]
FTSE 100 Small Inside Bar at Support, LL DB
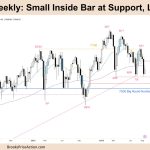
Market Overview: FTSE 100 Futures The FTSE futures market moved higher last week with a small inside bar, a bull bar. It is a pullback, and traders will expect a test of the low close or even to see what is below the big bear bar earlier. We are at support, a trend line and low […]
Emini Bears Getting 2nd Leg Down
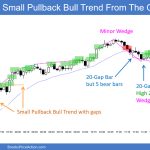
Trading Update: Friday August 25, 2023 S&P Emini pre-open market analysis Emini daily chart Emini 5-minute chart and what to expect today Yesterday’s Emini setups Al created the SP500 Emini charts. Here are several reasonable stop entry setups from yesterday. I show each buy entry with a green rectangle and each sell entry with a […]
Emini Bulls Likely to Become Disappointed
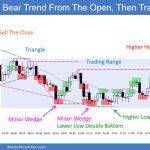
Trading Update: Thursday August 24, 2023 S&P Emini pre-open market analysis Emini daily chart Emini 5-minute chart and what to expect today Yesterday’s Emini setups Al created the SP500 Emini charts. Here are several reasonable stop entry setups from yesterday. I show each buy entry with a green rectangle and each sell entry with a […]
Emini Low 1 Short Following Bear Breakout
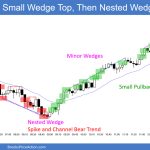
Trading Update: Wednesday August 23, 2023 S&P Emini pre-open market analysis Emini daily chart Emini 5-minute chart and what to expect today Emini intraday market update Yesterday’s Emini setups Al created the SP500 Emini charts. Here are several reasonable stop entry setups from yesterday. I show each buy entry with a green rectangle and each […]
Emini Vacuum Test of 100-Day Moving Average
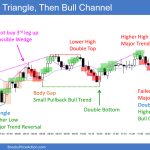
Trading Update: Tuesday August 22, 2023 S&P Emini pre-open market analysis Emini daily chart Emini 5-minute chart and what to expect today Yesterday’s Emini setups Al created the SP500 Emini charts. Here are several reasonable stop entry setups from yesterday. I show each buy entry with a green rectangle and each sell entry with a […]
Emini Test of 100-Day Moving Average
Trading Update: Monday August 21, 2023 S&P Emini pre-open market analysis Emini daily chart Emini 5-minute chart and what to expect today Friday’s Emini setups Al created the SP500 Emini charts. Here are several reasonable stop entry setups from Friday. I show each buy entry with a green rectangle and each sell entry with a […]
Nasdaq 100 Bull Body Gap with March 2022 Closed
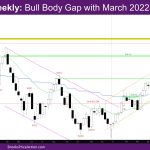
Market Overview: NASDAQ 100 Emini Futures The NASDAQ Emini futures week is a non-climactic bear bar with tails. The bull body gap with March 2022 closed this week. This is also the third consecutive bear bar, the first time since early December. Given the three bear bars, this will likely be a multi-legged pullback. The […]
Bitcoin at 26k after a Bear Breakout of a Tight Trading Range
Market Overview: Bitcoin Futures Bitcoin futures Bear Breakout of a Tight Trading Range on the daily chart. During the week, the value of the crypto asset decreased by 11.69%, and now is testing the HSB breakout point. Traders wonder if this is the end of the bull channel or if the price will reverse up […]

