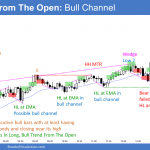
Trading Update: Thursday July 22, 2021 Emini pre-open market analysis Emini daily chart Yesterday saw Emini follow-through buying after Monday’s big bull reversal. Since yesterday had a bull body, it confirmed the reversal. That increases the chance of at least a small 2nd leg sideways to up after the 1st pullback. There is now a […]
SP500 Emini trade setups

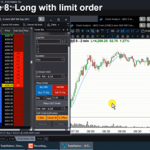
For Tuesday July 20, 2021 Full Emini and Forex daily reports will only be issued when Al is in the Trading Room. See sidebar calendar for “No Webinar” days when this “SP500 Emini trade setups” post will replace the daily report. Here are several reasonable stop entry setups from yesterday. I show each buy entry […]
Emini July reversal should lead to 15% correction back to 2020 close
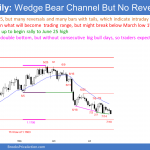
Trading Update: Tuesday July 20, 2021 Emini pre-open market analysis Emini daily chart Big gap down and big bear bar with possible Emini July reversal. This is after a big bear bar on Friday. However, yesterday closed above the middle of its range, increasing the chance of a further bounce today. It is a weak […]
SP500 Emini trade setups
For Friday July 16, 2021 Full Emini and Forex daily reports will only be issued when Al is in the Trading Room. See sidebar calendar for “No Webinar” days when this “SP500 Emini trade setups” post will replace the daily report. Here are several reasonable stop entry setups from yesterday. I show each buy entry […]
Scalping series:
#03 Ten Emini scalps on 15-second chart
Video duration 24min 17sec Ten Emini scalps on 15-second chart–Video transcript Introduction Hi, I’m Al Brooks and this is a Bonus Video on extreme scalping of the Emini 15-second chart. I hope you find it interesting. This video is an example of 10 consecutive scalps that I made today on a 15-second Emini chart. […]
Emini sell signal bar on weekly chart for possible July top
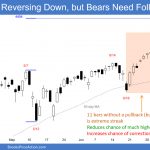
Weekend report co-author Andrew A. Market Overview: Weekend Market Analysis SP500 Emini sell signal bar on weekly chart. If July has a bear body on the monthly chart, then a 15 – 20% correction will likely be underway for the next 2 – 3 months. Without that, traders will bet that this reversal will be […]
Emini weekly sell signal might form late July
Trading Update: Friday July 16, 2021 Emini pre-open market analysis Emini daily chart Yesterday sold off from a test of the open of the week and traded below Wednesday’s low. This triggered a micro double top sell signal just below the 4,404 measured move target. A potential weekly sell signal setting up. However, yesterday closed […]
SP500 Emini trade setups
For Wednesday July 14, 2021 Full Emini and Forex daily reports will only be issued when Al is in the Trading Room. See sidebar calendar for “No Webinar” days when this “SP500 Emini trade setups” post will replace the daily report. Here are several reasonable stop entry setups from yesterday. I show each buy entry […]
Emini measured move target of 4,404 drawing near
Trading Update: Wednesday July 14, 2021 Emini pre-open market analysis Emini daily chart Another day, another new high, and Emini measured move 4,404 closer. Strong rally since since June 18, but yesterday reversed down from a new high. Yesterday is a sell signal bar for a failed new high, but after 3 bull bars closing […]
SP500 Emini trade setups
For Monday July 12, 2021 Full Emini and Forex daily reports will only be issued when Al is in the Trading Room. See sidebar calendar for “No Webinar” days when this “SP500 Emini trade setups” post will replace the daily report. Here are several reasonable stop entry setups from yesterday. I show each buy entry […]

