
For Monday August 2, 2021 Full Emini and Forex daily reports will only be issued when Al is in the Trading Room. See sidebar calendar for “No Webinar” days when this “SP500 Emini trade setups” post will replace the daily report. Here are several reasonable stop entry setups from yesterday. I show each buy entry […]
Emini bear bar should form on August monthly chart
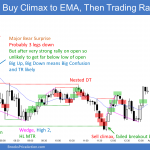
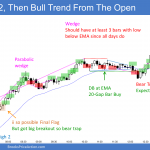
Trading Update: Monday August 2, 2021 Emini pre-open market analysis Emini daily chart First day of month. An Emini bear bar should form on August monthly chart. Friday triggered micro double top sell signal. Also was expanding triangle. However, Thursday was a bull bar and therefore a weak sell signal bar, especially in strong bull […]
Emini should form bear candlestick in August on monthly chart
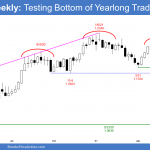
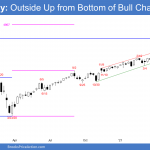
Weekend report co-author Andrew A. Market Overview: Weekend Market Analysis The SP500 Emini futures should form a bear candlestick in August on the monthly chart after a rare streak of 6 consecutive bull bars. If so, the Emini will probably correct 15 to 20% into October. The EURUSD Forex monthly chart formed a small doji […]
Emini should form 6th consecutive bull bar on monthly chart when July closes today
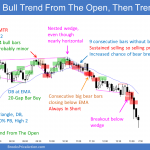
Trading Update: Friday July 30, 2021 Emini pre-open market analysis Emini daily chart Yesterday was the entry bar for a High 1 bull flag buy signal. Yesterday was a reversal day because it closed near the low. However, it had a bull body and it is therefore a lower probability sell signal bar. Now 6th […]
SP500 Emini trade setups
For Wednesday July 28, 2021 Full Emini and Forex daily reports will only be issued when Al is in the Trading Room. See sidebar calendar for “No Webinar” days when this “SP500 Emini trade setups” post will replace the daily report. Here are several reasonable stop entry setups from yesterday. I show each buy entry […]
Emini Expanding Triangle Top ahead of July FOMC announcement
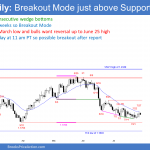
Trading Update: Wednesday July 28, 2021 Emini pre-open market analysis Emini daily chart Yesterday was a bear day after a strong 5-day rally to a new high. There is now a reversal down from an expanding triangle top. That is a major trend reversal pattern. When the context and sell signal bar are good, there […]
SP500 Emini trade setups
For Monday July 26, 2021 Full Emini and Forex daily reports will only be issued when Al is in the Trading Room. See sidebar calendar for “No Webinar” days when this “SP500 Emini trade setups” post will replace the daily report. Here are several reasonable stop entry setups from yesterday. I show each buy entry […]
Emini bulls after outside up week want follow-through buying at end of July
Trading Update: Monday July 26, 2021 Emini pre-open market analysis Emini daily chart The Emini on Friday broke to new all-time high (an outside up week) and reached the 4,404 measured move target based on the April through June trading range. It also broke above the 4,400 Big Round Number. The next target for the […]
Emini bulls want 6th consecutive bull bar on monthly chart
Market Overview: Weekend Market Analysis The SP500 Emini futures market rallied strongly this week and formed an outside up bar on the weekly chart. The bulls want July to be the 6th consecutive bull bar on the monthly chart when the month ends of Friday. That has not happened in 10 years. The EURUSD Forex […]
SP500 Emini trade setups
For Thursday July 22, 2021 Full Emini and Forex daily reports will only be issued when Al is in the Trading Room. See sidebar calendar for “No Webinar” days when this “SP500 Emini trade setups” post will replace the daily report. Here are several reasonable stop entry setups from yesterday. I show each buy entry […]

