Trading Update: Monday July 12, 2021 Emini pre-open market analysis Emini daily chart Strong bull trend and bull streaks. Friday made another new all-time high. Magnets above are measured move target at 4,404 and top of bull channel around 4,500. Streaks on daily and 60-minute charts ended last week. They increase the chance of exhausted […]
Emini rallying to channel top magnet at 4500
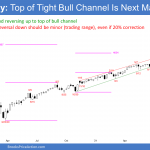
Weekend report co-author Andrew A. Market Overview: Weekend Market Analysis SP500 Emini rallying to channel top after a brief pullback on Thursday. It is trading just under the 4404 measured move target with the 4500 trend channel line a magnet above. Might transition into trading range for a week or two after the streak of […]
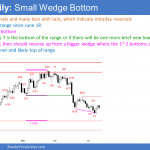
Emini likely in developing trading range after reversal up from test of July open
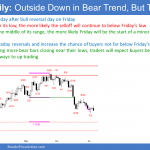
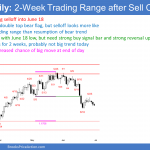
Trading Update: Friday July 9, 2021 Emini pre-open market analysis Emini daily chart Yesterday gapped down to below the open of the month, but rallied and closed near its high. Emini likely in developing trading range. There are 5 bull bars on the monthly chart and July will probably not be the sixth. Therefore, even […]
SP500 Emini trade setups

For Wednesday July 7, 2021 Full Emini and Forex daily reports will only be issued when Al is in the Trading Room. See sidebar calendar for “No Webinar” days when this “SP500 Emini trade setups” post will replace the daily report. Here are several reasonable stop entry setups from yesterday. I show each buy entry […]
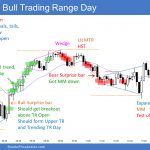
Emini bull streak evolving into trading range
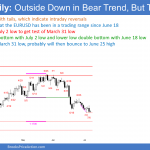
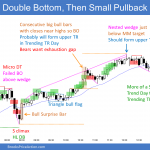
Trading Update: Wednesday July 7, 2021 Emini pre-open market analysis Emini daily chart Yesterday’s low was below Thursday’s low so daily chart finally had a pullback after 11-day bull micro channel. Pulled back below 60-minute 20-bar EMA for 1st time in 70 bars so that Emini bull streak ended as well. Traders were willing to […]
Emini with 11-bar bull micro channel in early July
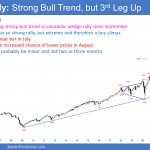
Trading Update: Tuesday July 6, 2021 Emini pre-open market analysis Emini daily chart 11-bar bull micro channel (every low at or above low of prior day). 60-minute chart has 69 bars above EMA so buy climax. Both are unusual and therefore unsustainable and buy climaxes. Should get a pullback this week. Since strong bull trend, […]
Emini in July extreme buy climax but 1st reversal will be minor
Market Overview: Weekend Market Analysis The SP500 Emini futures is breaking strongly above a 3-month bull channel in an extreme buy climax. The magnets above are the top of the bull channel and measured move targets. Since there have been 11 days without a pullback, there should be a brief pullback next week. The EURUSD […]
Emini June bull streaks should end soon
Trading Update: Friday July 2, 2021 Emini pre-open market analysis Emini daily chart Broke above 4,300 Big Round Number yesterday for the 1st time. Market has stalled at every Big Round Number over the past year, except 4,000. This increases the chance of at least a couple sideways days next week. Yesterday was the 10th […]
SP500 Emini trade setups
For Wednesday June 30, 2021 Full Emini and Forex daily reports will only be issued when Al is in the Trading Room. See sidebar calendar for “No Webinar” days when this “SP500 Emini trade setups” post will replace the daily report. Here are several reasonable stop entry setups from yesterday. I show each buy entry […]
Emini has 8-day bull micro channel at end of June
Trading Update: Wednesday June 30, 2021 Emini pre-open market analysis Emini daily chart I have been saying since last Monday that the Emini was likely to be strongly up through the 4th of July. It could reach the 4,400 measured move target before there is a correction. The past 5 days were small, but each […]

