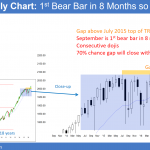
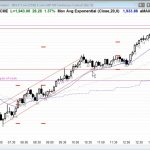
Monthly S&P500 Emini futures candlestick chart:October 5% correction before presidential election The monthly S&P500 Emini futures candlestick chart had a bear bar in September. After 7 consecutive bull trend bars, this therefore ends the buy climax. After 7 consecutive bull trend bars, the monthly S&P500 Emini futures candlestick chart finally had a bear body in […]
October 5% correction before presidential election
S&P500 Emini outside down day
Intraday market update: September 30, 2016
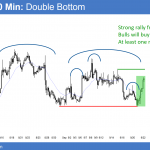
S&P500 Emini outside down day Updated 6:53 a.m. The Emini gapped above the 60 minute moving average after yesterday’s double bottom higher low major trend reversal. Yet, it formed an early tight trading range, and it is above yesterday’s midpoint. This increases the chances of an early selloff. Since yesterday was a big day and […]
October correction but not stock market crash
Intraday market update: September 29, 2016
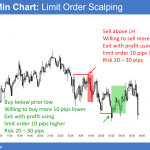
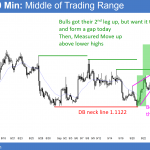
October correction but not stock market crash Updated 6:49 a.m. Today begin with a limit order market within the trading range at the end of yesterday. Furthermore, it opened at the open of the month. Since that is a magnet, the Emini will have a difficult time getting too far. As a result, this will […]
Post presidential debate stock market rally
Intraday market update: September 28, 2016
Post presidential debate stock market rally Updated 6:48 a.m. While the Emini gapped up and created another island bottom, the gap was small, yesterday’s tight trading range is a magnet, and the 1st bars were dojis. Hence, the odds are against a strong trend day today. Instead, today will probably have a lot of trading […]
Post debate stock market breakout
Intraday market update: September 27, 2016
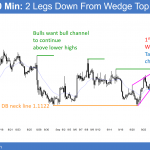
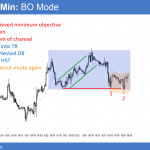
Post debate stock market breakout Updated 6:45 a.m. The Emini reversed up sharply from a bear breakout below a bear channel and from below yesterday’s low. It is back at the August 2 trading range low and the apex of the 5 day triangle. This is a sharp opening reversal at support. There is a […]
Island bottom and possible island top below all time high
Intraday market update: September 26, 2016
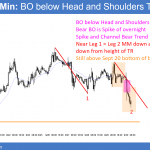
Island bottom and possible island top below all time high Updated 6:53 a.m. The Emini gapped down and formed a 2 day island top after last week’s lower high major trend reversal. While the 1st 2 bars had good bear bodies and today could become a trend from the open bear trend, it is more […]
Ask Al: Breakouts, when to exit or hold?
Breakout pullbacks — Exit or hold BPA trading room Q&A: October 2, 2015; June 28, 2016; July 6, 2016 Question 1: Al, if you buy a breakout, how do you determine when to get out breakeven and when to hold through the pullback? Video duration: 6min 02sec You can also view this video on Al’s […]
Stock market island bottom but October correction likely
Emini weekend update: September 24, 2016
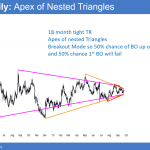
Monthly S&P500 Emini futures candlestick chart:1st time Emini has ever had 8 consecutive bull trend bars so buy climax The monthly S&P500 Emini futures candlestick chart has one more week before the month closes. It has been staying around the open of the month. If Friday closes above the 2161.75 open of the month, September […]
FOMC rally created island bottom
Intraday market update: September 23, 2016
FOMC rally created island bottom Updated 6:59 a.m. The Emini sold off below yesterday’s low on the open. Yet the bears were unable to create big bear bars. The bulls want the selloff to reverse up from the test into yesterday’s gap and of the open of the month. Because yesterday was a small day, […]
FOMC report created failed bear flag
Intraday market update: September 22, 2016
FOMC report created failed bear flag I will update around 6:50 a.m. The Emini had a big gap up after yesterday’s buy climax. While it still might rally for about 10 bars in the 1st 2 hours, the odds are that by the end of the 2nd hour, it will have at least a couple […]

