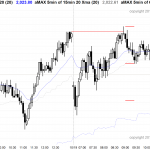
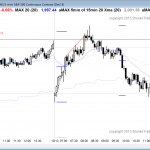
Posted 7:08 a.m. The Emini reversed up from above yesterday’s low with 4 bull trend bars closing above their midpoints. It is testing near the top of Friday’s trading range. Because Friday was a trading range day, the odds of a trading range day today are higher. While it is possible that this initial rally […]
Intraday market update: October 19, 2015
Ask Al: Second leg traps in trading ranges (USDJPY)
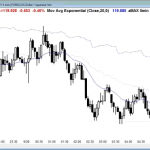
BPA trading room Q&A: September 28, 2015 I had a situation this morning at 09:00 EDT (06:00 PDT), on the 5 minute Dollar versus Yen Forex chart. It was late in the bear trend, price formed a trading range and a higher low… we had a bull breakout, but a lower high, and at the […]
Emini weekend update: October 17, 2015:
Learn how to trade bull candlestick patterns
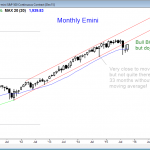
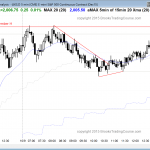
Monthly S&P500 Emini futures candlestick chart: Breakout of small bull flag at the moving average The monthly S&P500 Emini futures candlestick chart broke above last month’s high after the first pullback to the moving average in 38 months. This is a breakout above a 2 month bull flag. The bulls on the monthly S&P500 Emini […]
Intraday market update: October 15, 2015
Learn how to trade a bull flag
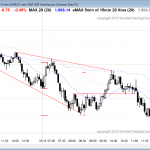
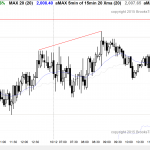
Posted 7:07 a.m. Today opened with a limit order market. Support was the moving average and resistance was at the two lower highs from yesterday. The bulls needed a breakout above the lower highs to end the bear channel. The bears want the channel to continue, but need a new low in addition to the […]
Intraday market update: October 14, 2015
Learn how to trade the markets in a bull flag
Posted 7:02 a.m. The Emini dipped 1 tick below yesterday’s low and reversed up with a pair of strong bull trend bars. That made the Emini Always In Long. Yesterday was a bear channel, and a bear channel usually transitions into a trading range rather than a bull trend. This means that there might be […]
Intraday market update: October 13, 2015
Learn how to trade the markets in a pullback
Posted 7:05 a.m. The Emini gapped down, but reversed up strongly from the 1st pullback to the 60 minute moving average in several days. The Emini is Always In Long, and there is a 70% chance that the 1st bar of the day will remain the low of the day or the low of the […]
Intraday market update: October 12, 2015
Learn how to trade the markets after trend exhaustion
Posted 7:15 a.m. Friday’s tight trading range continued on the open, and an early tight trading range increases the chances of a lot of trading range price action for the rest of the day. Friday was a doji day after Thursday’s buy climax. The climax was at resistance. The odds are that the Emini will […]
Ask Al: Where does the price action trader’s edge come from
BPA trading room Q&A: October 2, 2015 Can you talk about where the price action trader’s edge comes from, especially when institutions are very good at price action and can hire the best traders? Audio duration: 4min 34sec Audio transcript Do not worry about institutional trader’s edge My thought is that’s irrelevant. If the […]
Emini weekend update: October 10, 2015:
Learn how to trade the markets at the top of the trading range
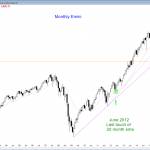
Monthly S&P500 Emini futures candlestick chart: Bull flag at the moving average The monthly S&P500 Emini futures candlestick chart is holding above the moving average after the first pullback to the average in 38 months. The monthly S&P500 Emini futures candlestick chart has tried to break below the moving average during each of the 3 […]
Intraday market update: October 9, 2015
Learn how to trade the markets in a breakout
Posted 7:15 a.m. The Emini broke above the September high by a couple of ticks and then reversed down. Since this is occurring after a buy climax, it reduces the chances of a strong bull trend day. The reversal down was strong enough to make the Emini Always In Short, but the rally yesterday was […]

