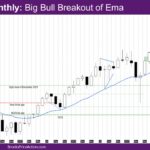
Market Overview: NASDAQ 100 E-mini Futures The NASDAQ E-mini futures April 2026 is a big bull breakout of EMA – exponential moving average. It is possibly the biggest bull bar ever. The week is a smaller bull bar compared to the bull bars of the past four weeks. This week makes it a 4-bar bull […]
Gold Diverges from the S&P 500
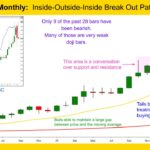
Gold GC-Mini Market Analysis The Gold GC-mini continues to range sideways with several bars overlapping. Sellers managed to post consecutive bear bars, something they have rarely achieved in over 7 months. This indicates increasing selling pressure. Meanwhile the S&P 500 is pushing up to new highs. GC-mini price action is happening on less volume, which […]
E-mini Testing 7,300 Round Number
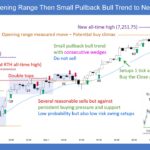
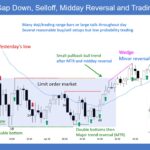
Trading Update: Friday May 1, 2026 S&P E-mini market analysis E-mini daily chart E-mini 5-minute chart and what to expect today Yesterday’s E-mini setups Richard created the SP500 E-mini chart. Here are reasonable stop entry setups from yesterday. Chart shows each buy entry bar with a green arrow and each sell entry bar with a […]
E-mini Upside is Likely Limited
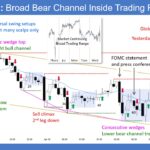
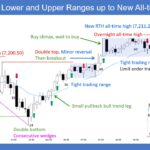
Trading Update: Thursday April 30, 2026 S&P E-mini market analysis E-mini daily chart E-mini 5-minute chart and what to expect today Yesterday’s E-mini setups Richard created the SP500 E-mini chart. Here are reasonable stop entry setups from yesterday. Chart shows each buy entry bar with a green arrow and each sell entry bar with a […]
E-mini Breakout Mode Going into FOMC
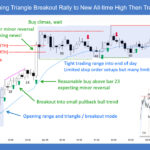
Trading Update: Wednesday April 29, 2026 E-mini end of day video review S&P E-mini market analysis E-mini daily chart E-mini 5-minute chart and what to expect today Yesterday’s E-mini setups Richard created the SP500 E-mini chart. Here are reasonable stop entry setups from yesterday. Chart shows each buy entry bar with a green arrow and […]
E-mini Sideways Likely For Several Weeks
Trading Update: Tuesday April 28, 2026 S&P E-mini market analysis E-mini daily chart E-mini 5-minute chart and what to expect today Yesterday’s E-mini setups Richard created the SP500 E-mini chart. Here are reasonable stop entry setups from yesterday. Chart shows each buy entry bar with a green arrow and each sell entry bar with a […]
E-mini Likely Profit Taking after Testing 7,200
Trading Update: Monday April 27, 2026 S&P E-mini market analysis E-mini daily chart E-mini 5-minute chart and what to expect today Friday’s E-mini setups Richard created the SP500 E-mini chart. Here are reasonable stop entry setups from Friday. Chart shows each buy entry bar with a green arrow and each sell entry bar with a […]
Bitcoin Weekly Testing Bear Flag Breakout Point at $80,000

Market Video Report: Bitcoin Duration 11:05 mins. Summary Bitcoin has probably transitioned from a long term bull trend into a major trading range between $50,000 and $125,000. While the daily chart shows a “small pullback bull trend,” the price is facing a weekly resistance that will either push back the price toward $68000 or accelerate […]
EURUSD Inside Doji Pullback
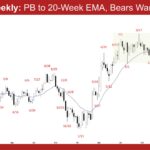
Market Overview: EURUSD Forex The market formed a EURUSD inside doji pullback to the 20-week EMA this week. Bulls want the 20-week EMA to act as support, leading to a second leg sideways to up. Bears want a reversal from a lower high major trend reversal, followed by a retest of the trading range low. […]
Crude Oil is Testing the Middle of the Trading Range
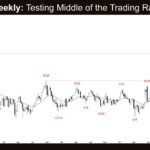
Market Overview: Crude Oil Futures Crude oil is testing the middle of the trading range this week, an area of balance that often acts as a magnet. Bulls want a retest of the March 9 high, even if it forms a lower high. Bears see the current move as a pullback and want it to […]

