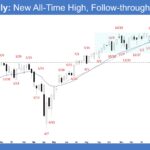
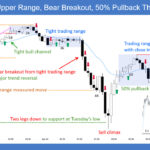
Market Overview: S&P 500 E-mini Futures The market formed an E-mini follow-through bull bar this week. Bulls want a strong breakout followed by a measured move based on the height of the recent trading range, projecting to around 7550. Bears see the rally as climactic and want at least a small sideways to down pullback […]
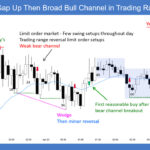
Nifty 50 Trading Range Price Action
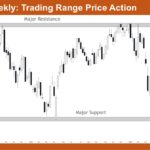
Market Overview: Nifty 50 Futures Nifty 50 Trading Range Price Action on the weekly chart. The market has been oscillating between major support around 21,600 and major resistance near 26,200 for several months, with neither bulls nor bears able to establish decisive control. The recent price action shows the market pulling back from the resistance […]
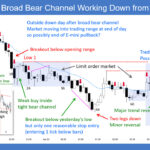
Nasdaq 100 4CC Bull Trend Bar and All-Time High Close
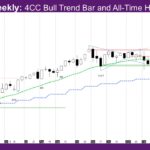
Market Overview: NASDAQ 100 E-mini Futures The NASDAQ E-mini futures week is a 4CC bull trend bar and all-time high close – 4CC meaning 4th consecutive. The daily chart started the channel phase this week after the spike last week – inside day, alternate bull/bear days, as well as a pullback day. The monthly bar […]
Gold Continues to Trade Sideways
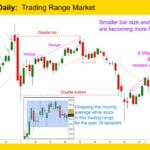
Gold GC-Mini Market Analysis TheGold GC-mini has been trading sideways for the past 4 weeks. The bear bar put a damper on the bulls ambitions to get over the 5000 psychological price point this week. There is still a prominent tail beneath the bear bar, showing the presence of determined bulls trying to prevent another […]
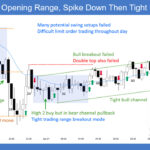
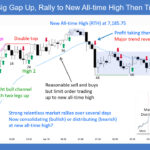
E-mini Testing 7,200 Round Number
Trading Update: Friday April 24, 2026 E-mini end of day video review S&P E-mini market analysis E-mini daily chart E-mini 5-minute chart and what to expect today Yesterday’s E-mini setups Richard created the SP500 E-mini chart. Here are reasonable stop entry setups from yesterday. Chart shows each buy entry bar with a green arrow and […]
E-mini Sideways For Next Several Weeks
Trading Update: Thursday April 23, 2026 E-mini end of day video review S&P E-mini market analysis E-mini daily chart E-mini 5-minute chart and what to expect today Yesterday’s E-mini setups Richard created the SP500 E-mini chart. Here are reasonable stop entry setups from yesterday. Chart shows each buy entry bar with a green arrow and […]
E-mini Sellers Above Yesterday’s High
Trading Update: Wednesday April 22, 2026 E-mini end of day video review S&P E-mini market analysis E-mini daily chart E-mini 5-minute chart and what to expect today Yesterday’s E-mini setups Richard created the SP500 E-mini chart. Here are reasonable stop entry setups from yesterday. Chart shows each buy entry bar with a green arrow and […]
E-mini Exhausted Bulls Pullback Likely to 7,000
Trading Update: Tuesday April 21, 2026 E-mini end of day video review S&P E-mini market analysis E-mini daily chart E-mini 5-minute chart and what to expect today Yesterday’s E-mini setups Richard created the SP500 E-mini chart. Here are reasonable stop entry setups from yesterday. Chart shows each buy entry bar with a green arrow and […]
E-mini Bulls Likely to Take Partial Profits
Trading Update: Monday April 20, 2026 E-mini end of day video review S&P E-mini market analysis E-mini daily chart E-mini 5-minute chart and what to expect today Friday’s E-mini setups Richard created the SP500 E-mini chart. Here are reasonable stop entry setups from Friday. Chart shows each buy entry bar with a green arrow and […]
MoneyShow X11 Outreach Group SCAM

WhatsApp Group SCAM Featuring Al Brooks! A significant number of aspiring traders/investors have been scammed by this WhatsApp group posing as a MoneyShow service supported by IKBR broker. The service features daily investment tips from their Chief Analyst Al Brooks!! Needless to say this is a pure 100% scam, so please be very careful of […]

