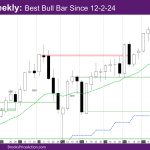
Market Overview: NASDAQ 100 Emini Futures The NASDAQ Emini futures week is a bull trend bar with almost no tails closing above last week’s high. It is the best bull bar since 12-2-24 and highest close of 2025. On the daily chart, the market is grinding up in a channel above the daily exponential moving […]
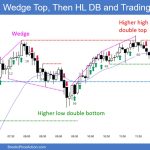
Emini Bull Breakout of Triangle
Trading Update: Friday February 14, 2025 Emini end of day video review Follow Joseph’s YouTube channel for more Al Brooks price action analysis. S&P Emini market analysis Emini daily chart Emini 5-minute chart and what to expect today Yesterday’s Emini setups Al created the SP500 Emini charts. Here are reasonable stop entry setups from yesterday. […]
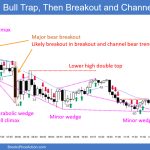
Emini Breakout Mode on Daily Chart
Trading Update: Thursday February 13, 2025 S&P Emini market analysis Emini daily chart Emini 5-minute chart and what to expect today Yesterday’s Emini setups Al created the SP500 Emini charts. Here are reasonable stop entry setups from yesterday. I show each buy entry bar with a green arrow and each sell entry bar with a […]
No Emini report today
Trading Update: Wednesday February 12, 2025 S&P Emini market analysis Yesterday’s Emini setups Al created the SP500 Emini charts. Here are reasonable stop entry setups from yesterday. I show each buy entry bar with a green arrow and each sell entry bar with a red arrow. Buyers of both the Brooks Trading Course and Encyclopedia […]
Emini Breakout Mode on Daily
Trading Update: Tuesday February 11, 2025 S&P Emini market analysis Emini daily chart Emini 5-minute chart and what to expect today Yesterday’s Emini setups Al created the SP500 Emini charts. Here are reasonable stop entry setups from yesterday. I show each buy entry bar with a green arrow and each sell entry bar with a […]
Emini Buyers below Last Thursday’s Low
Trading Update: Monday February 10, 2025 Emini end of day video review Follow Joseph’s YouTube channel for more Al Brooks price action analysis. S&P Emini market analysis Emini daily chart Emini 5-minute chart and what to expect today Yesterday’s Emini setups Al created the SP500 Emini charts. Here are reasonable stop entry setups from yesterday. […]
Bitcoin Breakout Mode Pattern
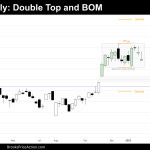
Market Overview: Bitcoin Friday’s closing price of Bitcoin Spot on Coinbase Exchange: $96,537. On the weekly chart, Bitcoin has formed a Breakout Mode Pattern (BOM), following a strong bullish breakout from an 8-month Trading Range that had developed over the past year. On the daily chart, a BOM pattern that formed at the top of […]
EURUSD Retest January Low
Market Overview: EURUSD Forex The EURUSD retest January low this week but lacked follow-through selling. The bulls see the current move (Feb 3) as a retest of the prior trend’s extreme low and want a higher low major trend reversal. If the market trades higher, the bears want the 20-week EMA to act as resistance. […]
Weekly Crude Oil Bear Leg
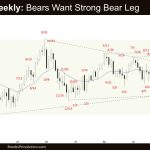
Market Overview: Crude Oil Futures The market formed a weekly Crude Oil bear leg testing the middle of the trading range. The bears want a strong bear leg to retest the bottom of the trading range. The bulls want a small sideways to up leg to retest the recent leg extreme high (Jan 15), even […]
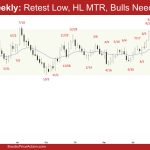
Weekly Emini Weak Pullback
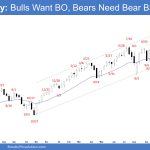
Market Overview: S&P 500 Emini Futures The market formed a weekly Emini weak pullback to the 20-week EMA. The bulls want a breakout into new all-time highs followed by a measured move based on the height of the recent 20-week trading range. The bears must do more to show that they are back in control. […]

