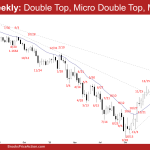
Market Overview: EURUSD Forex EURUSD bull leg currently forming in a trading range. Traders will BLSH (Buy Low, Sell High) within a trading range until there is a strong breakout from either direction with follow-through buying/selling. The bulls want a strong breakout above the February high. The bears want a reversal lower from a double top […]
Emini Follow-through Bar above 20-Week EMA
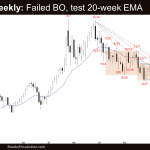
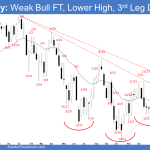
Market Overview: S&P 500 Emini Futures The S&P 500 Emini futures formed a weak follow-through bar after closing above the 20-week exponential moving average. While the move up since March 13 low is in a tight bull channel, it could simply be a bull leg within a trading range until there is a strong breakout […]
EURUSD Overlapping Candlesticks
Market Overview: EURUSD Forex The EURUSD Forex monthly chart has 3 overlapping candlesticks. That means that the EURUSD is in a trading range. The bears failed to get follow-through selling in March. The bulls need to create a follow-through bull bar trading above the February high to increase the odds of another leg higher. EURUSD […]
Crude Oil Failed Breakout
Market Overview: Crude Oil Futures The Crude oil futures looks like a Crude Oil failed breakout after trading far below the triangle and 16-week trading range but reversed higher into the trading range. The bears hope that the market will continue to trade sideways to down in April. The 4 consecutive doji(s) with prominent tails […]
Emini Bull Reversal Bar
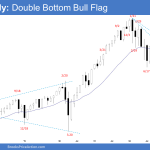
Market Overview: S&P 500 Emini Futures The S&P 500 Emini futures monthly candlestick was an Emini bull reversal bar closing near its high, reversing up from a double bottom bull flag (Dec 22 and Mar 13). Monday is the first trading day of the month. The market may gap up at the open, creating a […]
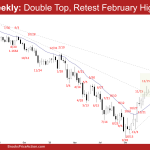
EURUSD Weak Breakout from OO
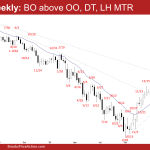
Market Overview: EURUSD Forex The EURUSD Forex weekly candlestick was a EURUSD weak breakout from an OO (outside-outside) pattern. The bulls will need to create follow-through buying to increase the odds of a retest of the February high. The bears want a failed breakout above the OO pattern and a breakout below instead. They want a reversal […]
Crude Oil Failed Bear Breakout
Market Overview: Crude Oil Futures The Crude oil futures traded slightly lower but had no follow-through selling on the weekly chart, a Crude Oil failed bear breakout. The bears hope that the move is simply a breakout test of the 16-week trading range low (breakout point) and wants at least a small second leg sideways […]
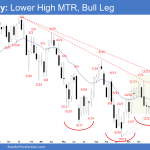
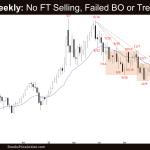
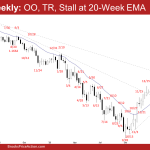
Emini Weak Bull Follow-through
Market Overview: S&P 500 Emini Futures The S&P 500 Emini futures weekly candlestick was a weak bull follow-through bar. The Emini is in a smaller 22-week trading range around 3750 and 4200. The market is currently trading around the middle of this range. Poor follow-through and reversals are hallmarks of a trading range. Traders will […]
Crude Oil Strong Breakout
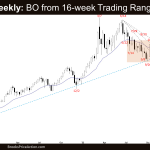
Market Overview: Crude Oil Futures Crude oil strong breakout below the 16-week trading range. They want a measured move down to around 57 using the height of the 16-week trading range. The bulls want a failed breakout and a reversal back into the middle of the trading range from a lower low major trend reversal […]
EURUSD OO Pattern but Dojis
Market Overview: EURUSD Forex The EURUSD Forex weekly chart formed an EURUSD OO pattern above the 20-week exponential moving average. So far, the bears have not yet been able to create follow-through selling below the 20-week EMA. The bulls want a second leg sideways to up but so far, have not yet been able to […]