Trading Update: Wednesday September 4, 2024 S&P Emini market analysis Emini daily chart Emini 5-minute chart and what to expect today Emini Intra Day Update Yesterday’s Emini setups Al created the SP500 Emini charts. Here are reasonable stop entry setups from yesterday. I show each buy entry bar with a green arrow and each sell […]
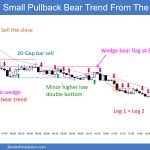
Emini Bears Increasing Selling Pressure
Trading Update: Tuesday September 3, 2024 End of day video review Follow Joseph’s YouTube channel for more Al Brooks price action analysis. S&P Emini market analysis Emini daily chart Emini 5-minute chart and what to expect today Friday’s Emini setups Al created the SP500 Emini charts. Here are reasonable stop entry setups from Friday (before […]
Bitcoin Sell Climax at $50000 and recovery in August

Market Overview: Bitcoin August has seen a dynamic start for Bitcoin, marked by a sharp sell climax that tested the significant $50,000 level, a key barrier. From this point, Bitcoin attempted a robust reversal towards July’s close, but the recovery was hindered by trapped bulls contributing to selling pressure. The initial buying surge during the […]
Monthly EURUSD Buy Vacuum
Market Overview: EURUSD Forex The market formed a monthly EURUSD buy vacuum test of the trading range high. The bulls need to create a follow-through bull bar in September following the breakout above the triangle to increase the odds of a breakout above the July high. The bears want a reversal from a double top […]
Monthly Crude Oil Double Top Bear Flag
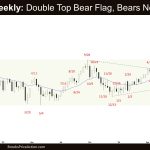
Market Overview: Crude Oil Futures The market formed a monthly Crude Oil double top bear flag trading around the middle of the trading range. The bears want the market to close far below the 20-month EMA and a breakout below the triangle pattern. The bulls want a reversal from a double bottom bull flag (Jun […]
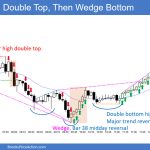
Monthly Emini Double Bottom Bull Flag
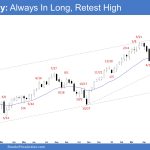
Market Overview: S&P 500 Emini Futures The market formed a monthly Emini double bottom bull flag and retest of the all-time high. The bulls want a breakout with follow-through buying, resuming the broad bull channel. The bears see the current move as a retest of the all-time high and want a reversal from a lower […]
Nifty 50 Breakout Gap
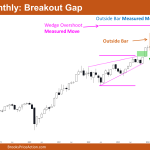
Market Overview: Nifty 50 Futures Nifty 50 Breakout Gap on the monthly chart. The market is currently in a strong bull trend. This month, it achieved a third consecutive strong bull close and is now approaching the wedge overshoot measured move target. In the upcoming week, the market might form a small bear bar due […]
Nasdaq 100 Bad H1 Buy Signal Bar at Ema
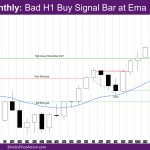
Market Overview: NASDAQ 100 Emini Futures The NASDAQ Emini futures August month candlestick is a bad H1 buy signal bar at EMA – exponential moving average. It is a big doji bar with essentially no body and a long tail below. The week is a bear doji bar with a tail below. It pulled back […]
DAX 40 Bull Outside Bar at 19000, Bull Channel
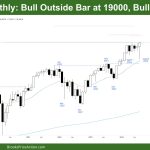
Market Overview: DAX 40 Futures DAX futures went higher last month with a bull outside bar in a bull channel. It was in breakout mode in a tight trading range for several months, and now we are just at 19000 Big Round Number. Stop-entry bulls are making money, so we should go higher. But the […]
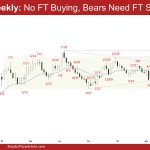
FTSE 100 Outside-Outside, Breakout Mode, Bull Channel
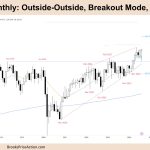
Market Overview: FTSE 100 Futures FTSE 100 futures went higher with a bull outside bar last month in an outside-outside pattern. Bears didn’t do enough to convince traders to get short, and now sideways to up is more likely. It might go up with two-legged pullbacks, but the bears could not make 1R selling below […]

