Trading Update: Wednesday August 23, 2023 S&P Emini pre-open market analysis Emini daily chart Emini 5-minute chart and what to expect today Emini intraday market update Yesterday’s Emini setups Al created the SP500 Emini charts. Here are several reasonable stop entry setups from yesterday. I show each buy entry with a green rectangle and each […]
Emini Vacuum Test of 100-Day Moving Average
Trading Update: Tuesday August 22, 2023 S&P Emini pre-open market analysis Emini daily chart Emini 5-minute chart and what to expect today Yesterday’s Emini setups Al created the SP500 Emini charts. Here are several reasonable stop entry setups from yesterday. I show each buy entry with a green rectangle and each sell entry with a […]
Emini Test of 100-Day Moving Average
Trading Update: Monday August 21, 2023 S&P Emini pre-open market analysis Emini daily chart Emini 5-minute chart and what to expect today Friday’s Emini setups Al created the SP500 Emini charts. Here are several reasonable stop entry setups from Friday. I show each buy entry with a green rectangle and each sell entry with a […]
Nasdaq 100 Bull Body Gap with March 2022 Closed
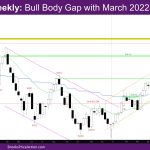
Market Overview: NASDAQ 100 Emini Futures The NASDAQ Emini futures week is a non-climactic bear bar with tails. The bull body gap with March 2022 closed this week. This is also the third consecutive bear bar, the first time since early December. Given the three bear bars, this will likely be a multi-legged pullback. The […]
Bitcoin at 26k after a Bear Breakout of a Tight Trading Range
Market Overview: Bitcoin Futures Bitcoin futures Bear Breakout of a Tight Trading Range on the daily chart. During the week, the value of the crypto asset decreased by 11.69%, and now is testing the HSB breakout point. Traders wonder if this is the end of the bull channel or if the price will reverse up […]
EURUSD Close below the 20-Week EMA
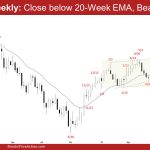
Market Overview: EURUSD Forex The EURUSD close below the 20-week EMA on the weekly chart. The bears need to create follow-through selling next week to increase the odds of lower prices. The bulls hope that the 20-week exponential moving average will act as support and want at least a small second leg sideways to up to retest […]
Crude Oil First Pullback below 7-bar Bull MC
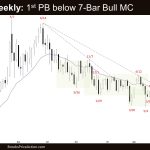
Market Overview: Crude Oil Futures The weekly chart formed a Crude Oil first pullback below the 7-bar bull microchannel. The bears need to create follow-through selling to increase the odds of the bear leg beginning. The bulls want a retest of the August 10 high followed by a breakout and a measured move up. Crude […]
Emini Test of the 20-Week EMA
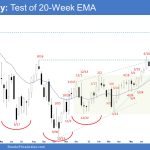
Market Overview: S&P 500 Emini Futures The bears created an Emini test of the 20-week EMA on the weekly chart. They need to create follow-through selling trading far below the 20-week EMA to increase the odds of a reversal down. The bulls see the move down as a minor pullback and want at least a […]
Nifty 50 Trading Range
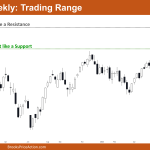
Market Overview: Nifty 50 Futures Nifty 50 Trading Range on the weekly chart. The market is fluctuating between the big round numbers 19000 and 20000 on the weekly chart, which serve as a support and a resistance, respectively. On the weekly chart, the Nifty 50 is exhibiting increasing trading range behaviour, increasing the likelihood that […]
DAX 40 Big Breakout and FT Below the MA, Trading Range
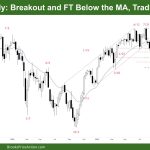
Market Overview: DAX 40 Futures DAX futures moved lower last week with consecutive bars below the MA. It was a breakout and FT after a failed break above the ATH. This is the largest streak of bear bars in nearly 12 months, so this is probably going to pull back soon. Bears want to close […]

