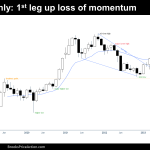
Market Overview: Bitcoin Futures Bitcoin futures 1st leg up loss of momentum. During July, the value of a Bitcoin decreased 4.22%. Traders wonder if this is the start of a retracement. A 1st leg up loss of momentum normally anticipates a retracement. Bitcoin futures The logarithmic Monthly chart of Bitcoin futures Analysis Trading The Weekly […]
EURUSD Broad Bull Channel
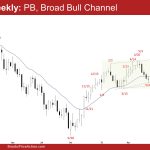
Market Overview: EURUSD Forex The last 7 candlesticks (monthly chart) have a lot of overlapping ranges but are sloping slightly up – the market is in a EURUSD broad bull channel following a bull spike from November. The bulls want a strong breakout above the April high followed by a few months of sideways to […]
Crude Oil Bull Microchannel
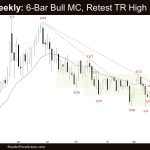
Market Overview: Crude Oil Futures The market formed a 6-bar Crude Oil Bull Microchannel on the weekly chart. It is a strong bull leg which increases the odds of buyers below the first pullback. The bulls want a breakout above the trading range high (April high). The bears want the market to stall around the […]
Emini Possible Minor Pullback
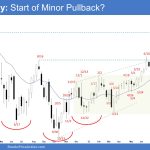
Market Overview: S&P 500 Emini Futures Is this the start of an Emini minor pullback? The bears will need to create consecutive strong bear bars closing near their lows to convince traders that a deeper pullback could be underway. The bulls want any pullback to be shallow and weak (with overlapping bars, doji(s) and bull […]
Free BTC Q&A webinar with Brad Wolff
Our dear Brad Wolff did a live Q&A session at 1pm PT / 4pm PT today. You can catch it here below, or via YouTube and Facebook live channels. Webinar recording will also be available after event on YouTube channel. Enjoy!
Nifty 50 Wedge Top Overshoot
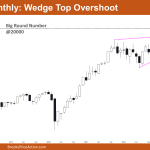
Market Overview: Nifty 50 Futures Nifty 50 Wedge Top Overshoot on the monthly chart. After the bull breakout of the wedge top, the market gave a weak bull close on the monthly chart. Bulls need good follow-through bars to successfully break out of the wedge top. Bulls need to provide a strong bull close above @20000 level in […]
Nasdaq 100 Follow-through to May and June Bull Bars
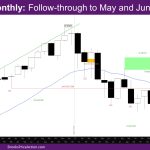
Market Overview: NASDAQ 100 Emini Futures The NASDAQ Emini futures July monthly candlestick is a small bull trend bar with small tails. This month represents follow-through to May and June bull bars. The week closed as an outside down bear bar. This is the first weekly close below the prior bar since early March. Now the […]
DAX 40 Big Failed BO above a Wedge Top, OD at MA
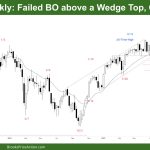
Market Overview: DAX 40 Futures DAX futures moved lower last week with a failed BO above a wedge top. It was a large outside down bar, so likely sellers above now. Buyers at the MA but will they look to buy lower instead now? Bears want a FT bar but have not had consecutive down […]
FTSE 100 Big Bear Outside Bar in Middle of TR
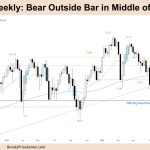
Market Overview: FTSE 100 Futures The FTSE futures market moved down last week with a bear outside bar. That means we triggered buyers above after a bull microchannel in the middle of a trading range. There were buyers again at the 200-week MA. It might be difficult for bears to sell through it. This week is […]
Emini Closed below Moving Average
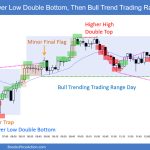
Trading Update: Friday August 4, 2023 S&P Emini pre-open market analysis Emini daily chart Emini 5-minute chart and what to expect today Emini intraday market update Yesterday’s Emini setups Al created the SP500 Emini charts. Here are several reasonable stop entry setups from yesterday. I show each buy entry with a green rectangle and each […]

