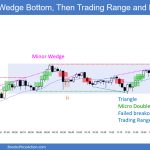
Trading Update: Wednesday July 12, 2023 S&P Emini pre-open market analysis Emini daily chart Emini 5-minute chart and what to expect today Emini intraday market update Yesterday’s Emini setups Al created the SP500 Emini charts. Here are several reasonable stop entry setups from yesterday. I show each buy entry with a green rectangle and each […]
Emini Balanced forming a Triangle
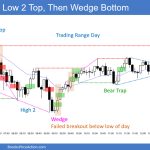
Trading Update: Tuesday July 11, 2023 S&P Emini pre-open market analysis Emini daily chart Emini 5-minute chart and what to expect today Yesterday’s Emini setups Al created the SP500 Emini charts. Here are several reasonable stop entry setups from yesterday. I show each buy entry with a green rectangle and each sell entry with a […]
Emini Likely in Breakout Mode
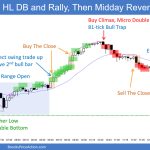
Trading Update: Monday July 10, 2023 S&P Emini pre-open market analysis Emini daily chart Emini 5-minute chart and what to expect today Friday’s Emini setups Al created the SP500 Emini charts. Here are several reasonable stop entry setups from Friday. I show each buy entry with a green rectangle and each sell entry with a […]
Using the Brooks Encyclopedia of Chart Patterns
Individual presenter webinar videos Al Brooks – How to Use the Brooks Encyclopedia of Chart Patterns Video duration: 12min 19sec YouTube link for those who cannot see video popup Brad Wolff – Using Encyclopedia on the Open, Opening Range, and up to Midday Video duration: 16min 27sec YouTube link for those who cannot see video […]
Bitcoin July 2023 Double Top in Bull Channel
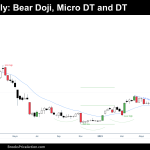
Market Overview: Bitcoin Futures Bitcoin Futures July 2023 Double Top in Bull Channel. During the week, the value of a Bitcoin decreased 0.86%. A couple of weeks ago, a bull signal was triggered, but the follow through was not good since it was a doji bar closing below the bull signal close. This week was […]
EURUSD Weak PB to 20-Week EMA
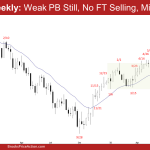
Market Overview: EURUSD Forex The EURUSD Forex formed a weak PB (Pullback) to the 20-week exponential moving average. The bulls see the pullback as forming a micro wedge. This week’s bull bar closing near its high is a buy signal bar for next week. The bears hope that the recent rally was simply a deep […]
Crude Oil Follow-through Bull Bar
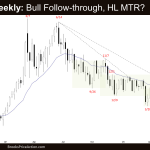
Market Overview: Crude Oil Futures The Crude oil futures formed a follow-through bull bar on the weekly chart. The bulls hope that this is the start of the bull leg to retest the April high. The bears want the 20-week exponential moving average and the bear trend line to act as resistance. They want the […]
Emini ioi pattern and No Follow-through Bull Bar
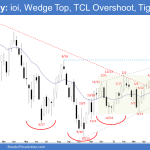
Market Overview: S&P 500 Emini Futures The weekly chart was an Emini ioi pattern (inside-outside-inside), which is a breakout mode pattern. The bulls did not get a follow-through bull bar following last week’s breakout above the August high. They want the market to trade above this week’s high to trigger the High 2 buy signal. However, a […]
Nifty 50 Broad Bull Channel
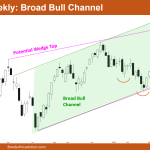
Market Overview: Nifty 50 Futures Nifty 50 Broad Bull Channel on the weekly chart. Following the large outside bar, the market this week produced a weak bull close with a long tail on the top. A few bears may sell because the market is trading near the top of a potential wedge top. On the daily […]
Nasdaq 100 Second Bear Reversal Bar in as Many Weeks
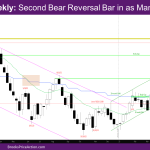
Market Overview: NASDAQ 100 Emini Futures The NASDAQ Emini futures short trading week is a small bear reversal bar with small tails above and below. This is the second bear reversal bar in as many weeks. At this point bears would like a close below the prior bar. That has not happened since early March. […]

