Trading Update: Wednesday May 17, 2023 S&P Emini pre-open market analysis Emini daily chart Emini 5-minute chart and what to expect today Emini intraday market update Yesterday’s Emini setups Richard created the SP500 Emini chart. Here are several reasonable stop entry setups from yesterday. I show each buy entry with a green rectangle and each […]
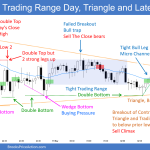
Emini Forming Tight Trading Range
Trading Update: Tuesday May 16, 2023 S&P Emini pre-open market analysis Emini daily chart Emini 5-minute chart and what to expect today Emini intraday market update Yesterday’s Emini setups Richard created the SP500 Emini charts (Al on leave). Here are several reasonable stop entry setups from yesterday. I show each buy entry with a green […]
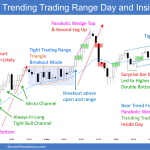
Emini Traders Likely to Face More Sideways Trading
Trading Update: Monday May 15, 2023 S&P Emini pre-open market analysis Emini daily chart Emini 5-minute chart and what to expect today Emini intraday market update Friday’s Emini setups Richard created the SP500 Emini charts (Al on leave). Here are several reasonable stop entry setups from Friday. I show each buy entry with a green […]
Bitcoin Test of Head and Shoulders Bottom Breakout Point
Market Overview: Bitcoin Futures Bitcoin test of head and shoulders bottom breakout point on the weekly chart. The price decreased its value by -11.02% during the week. Last week, instead of activating a bullish setup, the price reversed down and created a second leg sideways to down that happens after a bull breakout of a head and […]
EURUSD Big Bear Bar
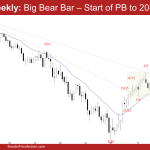
The EURUSD Forex formed a EURUSD big bear bar on the weekly chart. It is likely the start of the pullback phase following the bull’s repeated failed breakout above the February 2 high. The next targets for the bears are the 20-week exponential moving average and the March low. The bulls hope the 20-week exponential moving average […]
Crude Oil Bear Leg within Trading Range
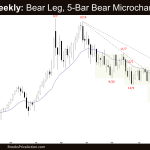
Market Overview: Crude Oil Futures The Crude oil futures formed a crude oil bear leg testing the March low. The bulls hope that the move is simply a sell vacuum and wants a reversal higher from a double bottom and a lower low major trend reversal. The bears want a strong breakout below the March […]
Emini ioi Pattern (inside-outside-inside)
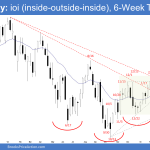
Market Overview: S&P 500 Emini Futures The S&P 500 Emini futures formed an an Emini ioi pattern (inside-outside-inside) on the weekly chart which means the market is in a breakout mode. However, the market is also in a 6-week tight trading range and the Emini is currently trading around the middle of it which is […]
Nifty 50 Trading Range Most Likely
Market Overview: Nifty 50 Futures Nifty 50 trading range most likely. This week’s market produced a bullish close; but, the bull bar’s small body and short top tail indicate that a small pullback is likely. On the weekly chart, the Nifty 50 is still trading inside the tight bull channel. The market recently has not created […]
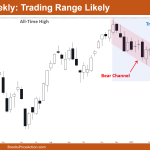
Nasdaq 100 Bull Leg in Trading Range
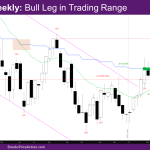
Market Overview: NASDAQ 100 Emini Futures The NASDAQ Emini futures ended the the week as a Nasdaq 100 bull leg with a doji bull bar and long tail above, closing just above last week’s high. The price action for the past few weeks looks like an expanding triangle – a new high, followed by a […]
DAX 40 Inside Bar, Weak Bear Close in Expanding Triangle
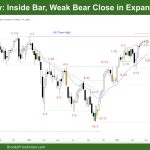
Market Overview: DAX 40 Futures DAX futures moved sideways last week, with a DAX 40 inside bar closing above its midpoint. The bull trend has been strong, and without bears closing consecutive bear bars, it’s hard for bears to swing short. There are open gaps below, and it looks like the bulls will get to […]

