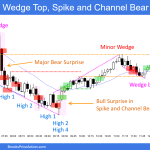
Trading Update: Tuesday April 25, 2023 S&P Emini pre-open market analysis Emini daily chart Emini 5-minute chart and what to expect today Yesterday’s Emini setups Al created the SP500 Emini charts. Here are several reasonable stop entry setups from yesterday. I show each buy entry with a green rectangle and each sell entry with a […]
Emini Oscillating around 4,150 in Tight Trading Range
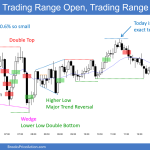
Trading Update: Monday April 24, 2023 S&P Emini pre-open market analysis Emini daily chart Emini 5-minute chart and what to expect today Friday’s Emini setups Al created the SP500 Emini charts. Here are several reasonable stop entry setups from Friday. I show each buy entry with a green rectangle and each sell entry with a […]
Bitcoin Breakout Test of HSB
Market Overview: Bitcoin Futures Bitcoin breakout test of HSB (Head and Shoulders Bottom). This week, the price decreased its value by -11.16%. The next week is the last trading week of April; So far, April is a small bear reversal bar. Bitcoin futures The Weekly chart of Bitcoin futures Analysis Trading The Daily chart of Bitcoin futures […]
EURUSD Inside Doji Bar, Tight Bull Channel
Market Overview: EURUSD Forex EURUSD inside doji bar and tight bull channel formed on weekly chart which means strong bulls. The bulls want a strong breakout above the February 2 high and another strong leg up. If there is a pullback, odds slightly favor buyers below the first pullback from such a strong bull micro channel. […]
Crude Oil Minor Pullback
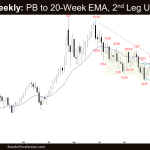
Market Overview: Crude Oil Futures Crude oil minor pullback formed on the weekly chart, partially closing the gap. The bulls expect at least a small second leg sideways to up after the current pullback. The bears need to create follow-through selling to increase the odds of the start of the bear leg within the trading […]
Emini 6-Bar Bull Micro Channel
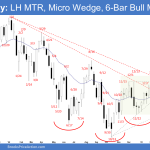
Market Overview: S&P 500 Emini Futures The S&P 500 Emini futures formed a 6-bar bull micro channel on the weekly chart. That means strong bulls. The bulls want a strong breakout above February 2 high completing the wedge pattern with the first two legs being December 13 and February 2. The bears hope that the […]
NASDAQ Tight Trading Range
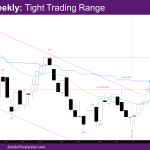
Market Overview: NASDAQ 100 Emini Futures The NASDAQ Emini futures market is essentially in a Nasdaq tight trading range for the past 3 weeks. It triggered the High 1 bull reversal bar of last week and ended as a small bear bar with tails above and below. Next week is the last week of the […]
DAX 40 Breakout above Expanding Triangle
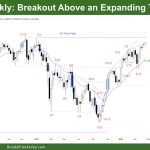
Market Overview: DAX 40 Futures DAX futures moved higher last week with a small doji. The bull breakout above expanding triangle is weak, but the small pullback bull trend is strong. We may need to get to the all-time high before bears get a decent sell signal. The bull channel line is far above, so […]
FTSE 100 Closed Bear Breakout Gap in Tight Range
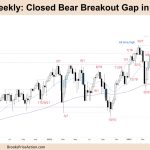
Market Overview: FTSE 100 Futures The FTSE futures market moved higher last week as bulls closed the bear breakout gap. Longer-term bulls bought the 200-week MA and are sitting on big profits. The bear spike down was strong enough, so likely sellers above and near the highs, so we might need to go sideways here. Expect […]
Nifty 50 Outside Bar
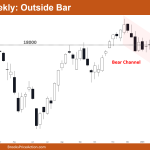
Market Overview: Nifty 50 Futures Nifty 50 outside bar on the weekly chart. The weekly chart of the market shows a bearish closing for this week. The bear bar has a short tail at the bottom, which may cause some bears to sell, especially following a powerful bull leg that broke out of the bear […]

