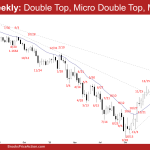
Market Overview: EURUSD Forex The EURUSD Forex monthly chart has 3 overlapping candlesticks. That means that the EURUSD is in a trading range. The bears failed to get follow-through selling in March. The bulls need to create a follow-through bull bar trading above the February high to increase the odds of another leg higher. EURUSD […]
Crude Oil Failed Breakout
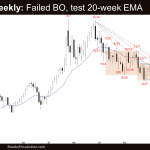
Market Overview: Crude Oil Futures The Crude oil futures looks like a Crude Oil failed breakout after trading far below the triangle and 16-week trading range but reversed higher into the trading range. The bears hope that the market will continue to trade sideways to down in April. The 4 consecutive doji(s) with prominent tails […]
Emini Bull Reversal Bar
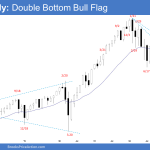
Market Overview: S&P 500 Emini Futures The S&P 500 Emini futures monthly candlestick was an Emini bull reversal bar closing near its high, reversing up from a double bottom bull flag (Dec 22 and Mar 13). Monday is the first trading day of the month. The market may gap up at the open, creating a […]
Nasdaq 100 Strong Bull Close above Monthly EMA
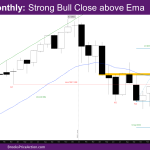
Market Overview: NASDAQ 100 Emini Futures The NASDAQ Emini futures March candlestick is a strong bull close trend bar closing at its high above the February month high. It is also the first bull close above the monthly exponential moving average (EMA) since March 2022. Since February was a weak sell signal bar in a […]
DAX 40 Outside Up, Back in Tight Trading Range
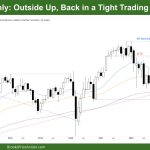
Market Overview: DAX 40 Futures DAX futures moved higher last month, with a Dax 40 outside up bull bar closing on its highs. It is a strong leg from the bulls, so it is still reasonable to make money buying closes and scaling in lower. But bears know we are in a tight trading range […]
FTSE 100 Failed Breakout or 50% Pullback
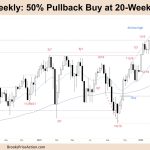
Market Overview: FTSE 100 Futures The FTSE futures market moved lower last month with a FTSE 100 failed breakout, a bear doji bar with a big tail. It is a pullback from the bull trend, and there were buyers below the moving averages. Some traders bought the breakout early and needed to scale in to make […]
Nifty 50 Doji Bar
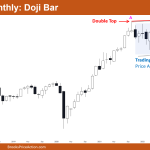
Market Overview: Nifty 50 Futures Nifty 50 doji bar on monthly chart. After three consecutive bear bars, the market created a doji bar this month. The monthly chart is in a bull trend, the market may be trading in a bull channel. The price action over the past 20 bars on the monthly chart shows […]
Emini Final Day of Month
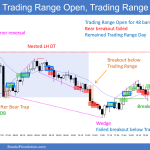
Trading Update: Friday March 31, 2023 S&P Emini pre-open market analysis Emini daily chart Emini 5-minute chart and what to expect today Yesterday’s Emini setups Al created the SP500 Emini charts. Here are several reasonable stop entry setups from yesterday. I show each buy entry with a green rectangle and each sell entry with a […]
Emini Bulls Chance for Strong Breakout above March 22nd
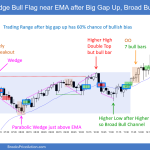
Trading Update: Thursday March 30, 2023 S&P Emini pre-open market analysis Emini daily chart Emini 5-minute chart and what to expect today Emini intraday market update Yesterday’s Emini setups Al created the SP500 Emini charts. Here are several reasonable stop entry setups from yesterday. I show each buy entry with a green rectangle and each […]
Emini Bulls Trying for 2nd Leg Up
Trading Update: Wednesday March 29, 2023 S&P Emini pre-open market analysis Emini daily chart Emini 5-minute chart and what to expect today Emini intraday market update (I will try and update through-out the day). Yesterday’s Emini setups Al created the SP500 Emini charts. Here are several reasonable stop entry setups from yesterday. I show each […]

