Trading Update: Monday January 23, 2023 Emini pre-open market analysis Emini daily chart Emini 5-minute chart and what to expect today Emini intraday market update Friday’s Emini setups Al created the SP500 Emini charts. Here are several reasonable stop entry setups from Friday. I show each buy entry with a green rectangle and each sell […]
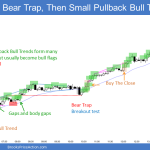
Bitcoin Bull Reversal from Final Flag
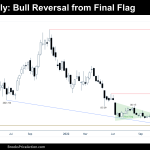
Market Overview: Bitcoin Futures Bitcoin futures are reversing up from a final flag pattern, a Bitcoin bull reversal. During the week, the price increased +14.53% of its value. The current rally is the biggest one since 2021. Bitcoin futures The Weekly chart of Bitcoin futures Analysis Trading The Daily chart of Bitcoin futures Analysis Trading […]
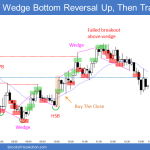
EURUSD Small Bull Doji, Wedge Top
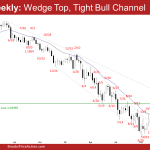
Market Overview: EURUSD Forex The EURUSD Forex was a small bull doji on the weekly chart. Bulls want an endless small pullback higher. If there is a pullback, they want the pullback to be sideways and shallow. The bears want a reversal lower from a wedge top. EURUSD Forex market The Weekly EURUSD chart The Daily EURUSD […]
Crude Oil 9-Week Trading Range
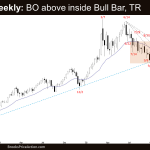
Market Overview: Crude Oil Futures The Crude oil futures market is in a 9-week trading range. This week was a breakout above the inside bull bar, but Crude Oil is sitting just under the 9-week trading range high, 20-week exponential moving average and bear trend line. The bulls will need to break far above these […]
Emini 5-Bar Bull Micro Channel
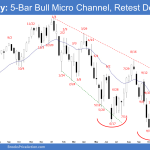
Market Overview: S&P 500 Emini Futures The S&P 500 Emini futures weekly chart is in a 5-bar bull micro channel. The bulls see this week as a pullback and want another leg higher testing the December high. Bears want a reversal down from a lower high major trend reversal. S&P500 Emini futures The Weekly S&P 500 Emini […]
Nifty 50 Consecutive Doji Bars
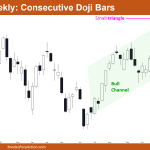
Market Overview: Nifty 50 Futures Nifty 50 consecutive Doji bars on the weekly chart imply the possible formation of a small trading range rather than a resumption up in the bull channel. Nifty 50 formed a bear flag on the daily chart and the current market is trading inside a triangle (which implies that there […]
Nasdaq 100 Bull Leg Pausing at Weekly EMA
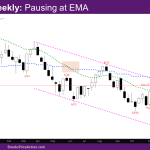
Market Overview: NASDAQ 100 Emini Futures The NASDAQ Emini futures market is in a trading range with bull leg pausing at the weekly exponential moving average (EMA). The question is how high will the bull leg be? The January monthly bar so far is a good bull reversal bar. A couple of problems for bulls: […]
DAX 40 Pause at Measured Move Target
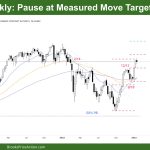
Market Overview: DAX 40 Futures DAX futures was a bear bar last week, a DAX 40 pause at a measured move target. The bulls know the channel is tight and expect another leg up, and they will probably get it. We are also at the underside of the prior trading range breakout, so we are […]
FTSE 100 Breakout Pullback, Always in Long
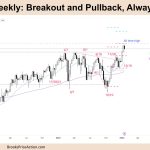
Market Overview: FTSE 100 Futures The FTSE futures market was a bear bar last week. It was a FTSE 100 breakout pullback bar just below the All-Time High. Most traders were expecting to reach the measured move target above and possibly the All-Time High. Bears were expecting to sell the highs of the range and now […]
Emini Second Leg Down Likely after January 18 Surprise Breakout
Trading Update: Friday January 20, 2023 Emini pre-open market analysis Emini daily chart Emini 5-minute chart and what to expect today Emini intraday market update Yesterday’s Emini setups Al created the SP500 Emini charts. Here are several reasonable stop entry setups from yesterday. I show each buy entry with a green rectangle and each sell […]

