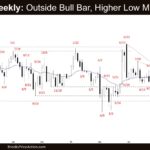
Market Overview: Crude Oil Futures The market formed a Crude oil outside bull bar on the weekly chart. Bulls need consecutive strong bull bars closing well above the 20-week EMA and the bear trend line to show they are regaining control. Bears want the 20-week EMA and the bear trend line to act as resistance. […]
E-mini Bulls Want a Strong Breakout
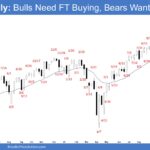
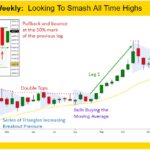
Market Overview: S&P 500 E-mini Futures The S&P 500 E-mini bulls want a strong breakout above the ascending triangle pattern with sustained follow-through buying to increase the odds of a trend resumption. Bears want the October 29 high area to act as resistance; if the market trades higher, they hope follow-through buying will be weak, […]
Nifty 50 Bear Outside Bar
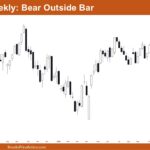
Market Overview: Nifty 50 Futures Nifty 50 Bear Outside Bar on the weekly chart. This week, the market gave a very strong bear close, closing below several previous weekly bars. In the previous week, the bulls attempted a breakout, but they failed to get good follow-through this week. On the daily chart, Nifty 50 gave […]
Nasdaq 100 Bull Bar Reversing 12-29 Bear Bar
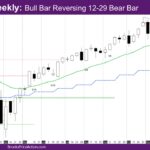
Market Overview: NASDAQ 100 E-mini Futures The NASDAQ E-mini futures week is a bull bar reversing 12-29 bear bar. The weekly and daily chart is at the apex of a triangle, with a bull bar on the daily chart at the daily exponential moving average (EMA). NASDAQ 100 Emini futures The Weekly NASDAQ chart The […]
Gold Futures Strong Bull Momentum
Gold GC-Mini Market Analysis The Gold GC-mini continued its march upward, reclaiming almost all the ground it lost the week prior. Moves downward tended to be weak with large tails beneath the bear bars while moves upward are bull bars closing near the extremes. Pullbacks are being treated as buying opportunities for bulls. The overall […]
E-mini Profit Taking Near All-Time High
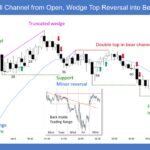
Trading Update: Friday January 9, 2026 S&P E-mini market analysis E-mini daily chart E-mini 5-minute chart and what to expect today Yesterday’s E-mini setups Richard created the SP500 E-mini chart. Here are reasonable stop entry setups from yesterday. Chart shows each buy entry bar with a green arrow and each sell entry bar with a […]
E-mini Sellers at 7,000 Round Number
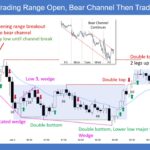
Trading Update: Thursday January 8, 2026 S&P E-mini market analysis E-mini daily chart E-mini 5-minute chart and what to expect today Yesterday’s E-mini setups Jed created the SP500 E-mini chart. Here are reasonable stop entry setups from yesterday. Chart shows each buy entry bar with a green arrow and each sell entry bar with a […]
E-mini Testing All-time High and 7,000 Round Number
Trading Update: Wednesday January 7, 2026 S&P E-mini market analysis E-mini daily chart E-mini 5-minute chart and what to expect today Yesterday’s E-mini setups Richard created the SP500 E-mini chart. Here are reasonable stop entry setups from yesterday. Chart shows each buy entry bar with a green arrow and each sell entry bar with a […]
E-mini Unable to Escape Test of All-Time High
Trading Update: Tuesday January 6, 2026 S&P E-mini market analysis E-mini daily chart E-mini 5-minute chart and what to expect today Yesterday’s E-mini setups Richard created the SP500 E-mini chart. Here are reasonable stop entry setups from yesterday. Chart shows each buy entry bar with a green arrow and each sell entry bar with a […]
E-mini Breakout Mode near All-Time High
Trading Update: Monday January 5, 2026 E-mini end of day video review Follow Joseph’s YouTube channel for more Al Brooks price action analysis. S&P E-mini market analysis E-mini daily chart E-mini 5-minute chart and what to expect today Friday’s E-mini setups Richard created the SP500 E-mini chart. Here are reasonable stop entry setups from Friday. […]

