Market Video Overview Tim Fairweather’s weekly report on the DAX 40 and FTSE 100 futures market. Follow Tim Fairweather’s YouTube channel for more Al Brooks price action analysis. Market analysis reports archive You can access all weekend reports on the Market Analysis page.
Bitcoin hint buyers below $80,000
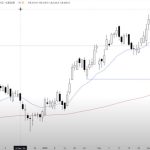
Market Overview: Bitcoin Monday marks the final Bitcoin’s trading day of March and Q1 2025—a prime moment to decode price action. I’ve said it before: expect buying pressure from rebalancing. Q1’s close pushes institutions to adjust portfolios, bringing buyers into play. That alone won’t lift prices—it’s just a piece of the puzzle. Al Brooks cuts […]
Weekly Weak EURUSD Pullback
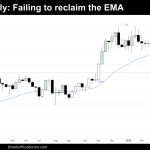
Market Overview: EURUSD Forex The market formed a weekly weak EURUSD pullback, the candlestick closing as a bull doji with a long tail below. The bulls expect to get at least a small sideways to up leg to retest the recent leg extreme high (Mar 18), even if it only forms a lower high. If […]
Crude Oil Pullback to the Middle of Trading Range
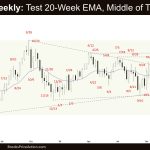
Market Overview: Crude Oil Futures Crude Oil pullback to the middle of trading range on the weekly chart. The bulls need to create more follow-through buying trading far above the 20-week EMA to increase the odds of the bull leg beginning. The bears hope to get a retest of the March 5 low after the […]
Weekly Weak Emini Pullback
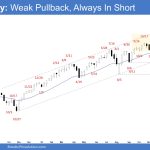
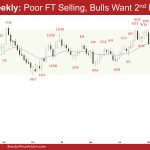
Market Overview: S&P 500 Emini Futures The market formed a weekly weak Emini pullback, forming an outside bear bar closing near its low. The bears want a retest and breakout below the March 13 low. The bulls want the September or August lows to act as support. S&P500 Emini futures The Weekly S&P 500 Emini […]
Nasdaq 100 First Close Below Monthly Ema Since October 2023
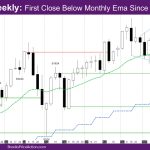
Market Overview: NASDAQ 100 Emini Futures The NASDAQ Emini futures week is a big outside down bear bar closing on its low just below the monthly EMA – exponential moving average. It is the first close below monthly EMA since October 2023. The daily chart started with two bull days to go above the daily […]
Nifty 50 Bull Breakout
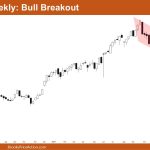
Market Overview: Nifty 50 Futures Nifty 50 Bull Breakout on the weekly chart. This week, the market closed with a doji candlestick, featuring a long upper tail. For a successful bull breakout, the bulls need strong follow-through. On the daily chart, the Nifty 50 nearly reached the measured move of the measuring gap, but the […]
Emini Weak High 1 Buy Signal Bar
Trading Update: Friday March 28, 2025 Emini end of day video review S&P Emini market analysis Emini daily chart Emini 5-minute chart and what to expect today Yesterday’s Emini setups Al created the SP500 Emini charts. Here are reasonable stop entry setups from yesterday. I show each buy entry bar with a green arrow and […]
Emini Bad Follow-Through after Yesterday’s Selloff
Trading Update: Thursday March 27, 2025 S&P Emini market analysis Emini daily chart Emini 5-minute chart and what to expect today Yesterday’s Emini setups Al created the SP500 Emini charts. Here are reasonable stop entry setups from yesterday. I show each buy entry bar with a green arrow and each sell entry bar with a […]
Emini Bulls Getting Close above Daily Moving Average
Trading Update: Wednesday March 26, 2025 Emini end of day video review Follow Rose’s YouTube channel for more Al Brooks price action analysis. S&P Emini market analysis Emini daily chart Emini 5-minute chart and what to expect today Yesterday’s Emini setups Al created the SP500 Emini charts. Here are reasonable stop entry setups from yesterday. […]

