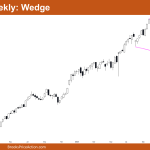
Market Overview: Nifty 50 Futures Nifty 50 Wedge on the weekly chart. This week, the market formed a small doji bar and is trading within a wedge pattern. The bull trend remains intact, as a reversal has not yet been confirmed. A successful breakout from the wedge in either direction will determine the next trend. […]
Nasdaq 100 Big Buy Signal Bar at Ema
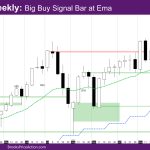
Market Overview: NASDAQ 100 Emini Futures The NASDAQ Emini futures week is a big buy signal bar at EMA – exponential moving average. The week has a bigger tail below and a small tail above. On the daily chart, the market looks like a bull leg up in trading range between the daily and weekly […]
Emini Strong Reversal up on Daily
Trading Update: Friday January 17, 2025 S&P Emini market analysis Emini daily chart Emini 5-minute chart and what to expect today Yesterday’s Emini setups Al created the SP500 Emini charts. Here are reasonable stop entry setups from yesterday. I show each buy entry bar with a green arrow and each sell entry bar with a […]
Emini at Moving Average on Daily Chart
Trading Update: Thursday January 16, 2025 S&P Emini market analysis Emini daily chart Emini 5-minute chart and what to expect today Yesterday’s Emini setups Al created the SP500 Emini charts. Here are reasonable stop entry setups from yesterday. I show each buy entry bar with a green arrow and each sell entry bar with a […]
Emini Bulls Getting Upside Breakout
Trading Update: Wednesday January 15, 2025 S&P Emini market analysis Emini daily chart Emini 5-minute chart and what to expect today Yesterday’s Emini setups Al created the SP500 Emini charts. Here are reasonable stop entry setups from yesterday. I show each buy entry bar with a green arrow and each sell entry bar with a […]
Emini Bulls Want Strong Entry Bar Today
Trading Update: Tuesday January 14, 2025 Emini end of day video review Follow Joseph’s YouTube channel for more Al Brooks price action analysis. S&P Emini market analysis Emini daily chart Emini 5-minute chart and what to expect today Yesterday’s Emini setups Al created the SP500 Emini charts. Here are reasonable stop entry setups from yesterday. […]
Emini Bears Want Test of November Low
Trading Update: Monday January 13, 2025 Emini end of day video review You can also watch Joseph’s EOD Review for today on his YouTube channel. S&P Emini market analysis Emini daily chart Emini 5-minute chart and what to expect today Friday’s Emini setups Al created the SP500 Emini charts. Here are reasonable stop entry setups […]
Bitcoin potential market top
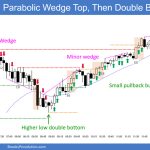
Market Overview: Bitcoin This week, Bitcoin traded slightly below December’s low, triggering the monthly bear signal discussed in the previous report. It is likely that the price will test below December’s low again during January, within the next 0–3 weeks. Both the weekly and daily charts present intriguing patterns worth dissecting.If you missed our special […]
Weekly EURUSD Breakout Below the Trading Range
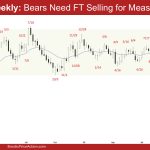
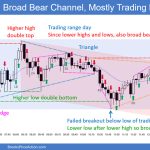
Market Overview: EURUSD Forex The market formed a weekly EURUSD breakout below the trading range. The bears want a measured move based on the height of the trading range. The bulls want a reversal from a large double bottom bull flag (Oct 3 and Jan 2), a wedge pattern (Oct 23, Nov 22, and Jan […]
Weekly Crude Oil Breakout Above the Triangle
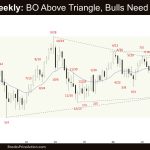
Market Overview: Crude Oil Futures The market formed a weekly Crude Oil breakout above the triangle pattern. The bulls want a measured move based on the height of the tight trading range which will take them to the July high area. The bears want a reversal from a double top bear flag (Oct 8 and […]

