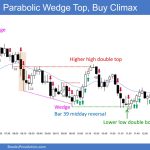
Trading Update: Monday December 9, 2024 Emini end of day video review Follow Joseph’s YouTube channel for more Al Brooks price action analysis. S&P Emini market analysis Emini daily chart Emini 5-minute chart and what to expect today Friday’s Emini setups Al created the SP500 Emini charts. Here are reasonable stop entry setups from Friday. […]
Dax 40: High 2 near Measured Move Targets
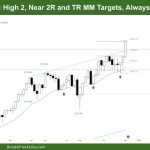
Market Video Overview: DAX 40 Futures Tim Fairweather’s weekly report on the DAX 40 futures market. Follow Tim Fairweather’s YouTube channel for more Al Brooks price action analysis. Market analysis reports archive You can access all weekend reports on the Market Analysis page.
FTSE 100: Back in Middle of Tight Trading Range
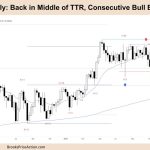
Market Video Overview: FTSE 100 Futures Tim Fairweather’s weekly report on the FTSE 100 futures market. Follow Tim Fairweather’s YouTube channel for more Al Brooks price action analysis. Market analysis reports archive You can access all weekend reports on the Market Analysis page.
Bitcoin testing the $100,000 magnet
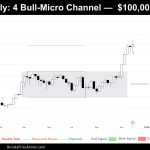
Market Overview: Bitcoin Last week, we analyzed Bitcoin‘s November close, which settled below the significant $100,000 level. This week, history was made as Bitcoin surpassed $100,000 for the first time on Thursday, December 5th. The $100,000 mark acted as a strong magnet for price action throughout the week, demonstrating its psychological and technical importance. With […]
Weekly EURUSD Breakout Pullback
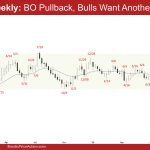
Market Overview: EURUSD Forex The market formed a weekly EURUSD breakout pullback in the last 2 weeks. The bears want a retest of the trading range low followed by a strong breakout and measured move based on the height of the trading range. The bulls want a failed breakout and the trading range low to […]
Weekly Crude Oil Wedge Bear Flag
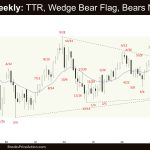
Market Overview: Crude Oil Futures The market formed a weekly Crude Oil wedge bear flag (Oct 24, Nov 7, and Nov 22). The bears must create sustained follow-through selling to increase the odds of a breakout below the triangle. The bulls see the current move as a three-legged pullback – a wedge bull flag (Oct […]
Emini Continue Trading Sideways to Up
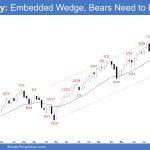
Market Overview: S&P 500 Emini Futures The Emini continue trading sideways to up with no credible selling pressure. The bulls see the market as being in a broad bull channel and want the market to continue sideways to up for many months. If there is a pullback, they want the 20-week EMA or the bull […]
Nifty 50 Trading Range
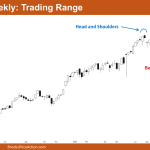
Market Overview: Nifty 50 Futures Nifty 50 Trading Range on the weekly chart. The weekly chart shows a bullish close this week, confirming the failure of the head and shoulders top pattern. This increases the likelihood of a trading range instead of a reversal. Additionally, the market has broken out of the bear channel with […]
Nasdaq 100 Good Bull Follow-Through to Doji Entry Bar of 11-25
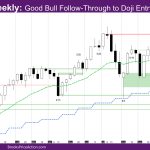
Market Overview: NASDAQ 100 Emini Futures The NASDAQ Emini futures week is a good bull follow-through to doji entry bar of 11-25. On the daily chart, the market is accelerating up from the exponential moving average (EMA). Three of the five days were non-climactic bull trend bars although with bad follow-through. The month is already […]
Emini Tight Bull Channel
Trading Update: Friday December 6, 2024 Emini end of day video review You can also watch Joseph’s EOD Review for today on his YouTube channel. S&P Emini market analysis Emini daily chart Emini 5-minute chart and what to expect today Yesterday’s Emini setups Al created the SP500 Emini charts. Here are reasonable stop entry setups […]

