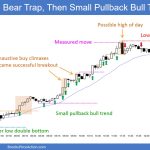
Trading Update: Tuesday June 18, 2024 S&P Emini pre-open market analysis Emini daily chart Emini 5-minute chart and what to expect today= Yesterday’s Emini setups Al created the SP500 Emini charts. Here are reasonable stop entry setups from yesterday. I show each buy entry bar with a green arrow and each sell entry bar with […]
Emini Weak High 1 Buy Signal Bar
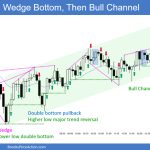
Trading Update: Monday June 17, 2024 S&P Emini pre-open market analysis Emini daily chart Emini 5-minute chart and what to expect today Friday’s Emini setups Al created the SP500 Emini charts. Here are reasonable stop entry setups from Friday. I show each buy entry bar with a green arrow and each sell entry bar with […]
Weekly Crude Oil Pullback
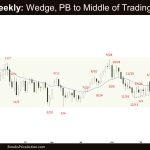
Market Overview: Crude Oil Futures The market formed a weekly Crude Oil pullback to the middle of the trading range on the weekly chart. The bulls want a retest of the April 12 high after the current pullback and the bull trend line to act as support. The bears want the 20-week EMA and the bear trend line to […]
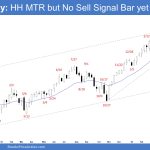
EURUSD Bears Need Follow-through
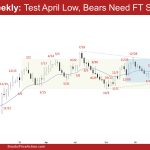
Market Overview: EURUSD Forex The EURUSD bears need follow-through selling following this week’s bear bar closing below the 20-week EMA. The bulls want a reversal from a higher low major trend reversal or a double bottom with the April low. The EURUSD is trading near the lower third of the smaller trading range which can […]
Bitcoin potential short-term break down shift from $70000
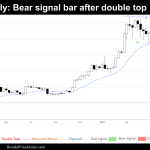
Market Overview: Bitcoin Bitcoin‘s price action is at a pivotal point, as the weekly chart reveals a potential shift in short-term momentum. This week’s bearish candlestick suggests that bears might be gaining influence, posing a challenge to the bulls. The market is now at a crucial juncture, with the resolution of this consolidation phase likely […]
Emini Sideways to Up
Market Overview: S&P 500 Emini Futures The market formed an Emini sideways to up breaking into new high territory. The bulls want to get another strong leg up completing the wedge pattern with the first two legs being July 27 and March 21. The third leg up is currently underway. If the market trades higher, the bears want a micro wedge to form […]
FTSE 100 Second Leg Down, Test Breakout Point
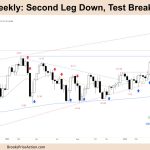
Market Overview: FTSE 100 Futures FTSE 100 futures went lower last week, with a second leg down in a strong pullback from the ATH. We are always in short on the daily chart, which is likely to become a bull flag on this chart. But it’s disappointing for the bulls, who should not have let […]
DAX 40 Weekly: Failed Bull Breakout, Test Last Leg, WT
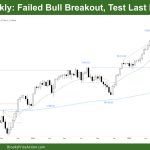
Market Overview: DAX 40 Futures DAX futures went lower last week with a failed bull breakout, pulling back to the MA after three legs up. It was a double top, and we will likely form a trading range up here between 18000 and 19000. The bulls want a double bottom test of the high and […]
Nasdaq 100 Biggest Bull Body Since October 2023
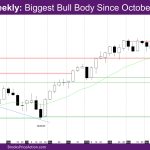
Market Overview: NASDAQ 100 Emini Futures The NASDAQ Emini futures week is a big bull trend bar closing near its high. It is another new all-time high close above June 3 high. It is also the biggest bull body since October. On the daily chart, there is a 4-bar bull micro-channel as the low of […]
Nifty 50 Trading Range Breakout
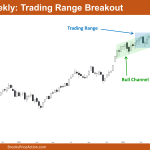
Market Overview: Nifty 50 Futures Nifty 50 Trading Range Breakout on the weekly chart. This week, the market closed with a small bullish body, indicating a trading range price action on the lower time frame after the high volatility caused by the election results. The market also broke out of the trading range, suggesting a […]

