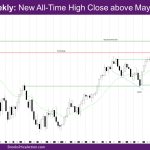
Market Overview: NASDAQ 100 Emini Futures The NASDAQ Emini futures week is a bull trend bar with a prominent tail above and below. The market had a new all-time high close above May 27 high. Also, the bull body gap with the March high close is still open. On the daily chart, Wednesday was a […]
FTSE 100 ATH, Bull Channel, Sideways Expected
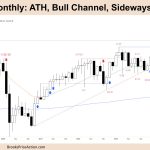
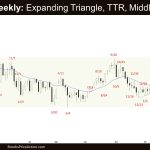
Market Overview: FTSE 100 Futures FTSE 100 futures moved higher last month in a bull channel, but the bar had a big tail. Who is selling? Bulls are taking profits after a strong breakout. Bears want to close the breakout gap, and bulls want a pullback to buy again. We have been in a trading […]
Emini Sideways Likely for Bears
Trading Update: Friday June 7, 2024 S&P Emini pre-open market analysis Emini daily chart Emini 5-minute chart and what to expect today Summary of today’s S&P Emini price action Al created the SP500 Emini charts. See the weekly update for a discussion of the price action on the weekly chart and for what to expect […]
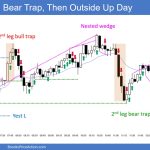
Emini Bulls Hopeful for 2nd Leg Up
Trading Update: Thursday June 6, 2024 S&P Emini pre-open market analysis Emini daily chart Emini 5-minute chart and what to expect today Summary of today’s S&P Emini price action Al created the SP500 Emini charts. End of day video review Live stream videos to follow Monday, Wednesday and Friday (subject to change). See the weekly […]
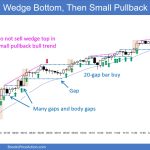
Emini Buyers below the First Pullback
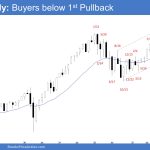
Market Overview: S&P 500 Emini Futures There were Emini buyers below the first pullback on the monthly chart. The bulls hope to get another strong leg up completing the wedge pattern with the first two legs being July 27 and March 21. The bears want a reversal from a higher high major trend reversal and a large wedge pattern (Dec 2, July 27, and March 21). S&P500 […]
Weekly Crude Oil Tight Trading Range
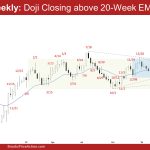
Market Overview: Crude Oil Futures The market formed a weekly Crude Oil tight trading range in the form of 4 overlapping candlesticks. The bears see the tight trading range simply as a sideways pullback and want another strong leg down. The bulls want the 20-week EMA or the bull trend line to act as support. […]
EURUSD Triangle
Market Overview: EURUSD Forex The monthly chart formed a EURUSD triangle. The bulls need to create a follow-through bull bar in June to increase the odds of higher prices. If the market trades higher, the bears want a reversal from a double top bear flag with the March 8 high. EURUSD The Monthly EURUSD Forex […]
Bitcoin monthly bulls limiting downside risk
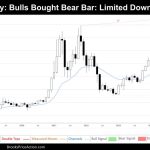
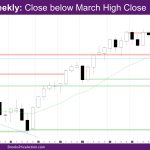
Market Overview: Bitcoin Bitcoin‘s May bullish candle, emerging after April’s retracement, reaffirms the resilience of the upward trend despite earlier failures to surpass all-time highs. However, the long upper wick of the May candle reveals a rejection of higher prices near the March close, suggesting a potential struggle for bulls to maintain control at elevated […]
Nasdaq 100 New High Close Just below April Month High
Market Overview: Nasdaq 100 Futures The NASDAQ Emini futures May monthly candlestick is a big bull bar with a prominent tail above. It is a new high close just below April month high. The week is a bear bar with a long tail below. The last two weeks’ reports had made the case that at least […]
Emini Bears Want 2nd Leg Down
Trading Update: Friday May 31, 2024 S&P Emini pre-open market analysis Emini daily chart Emini 5-minute chart and what to expect today Yesterday’s Emini setups Al created the SP500 Emini charts. Here are reasonable stop entry setups from yesterday. I show each buy entry bar with a green arrow and each sell entry bar with […]

