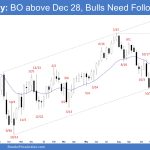
Market Overview: S&P 500 Emini Futures The weekly chart: The Emini breakout above the Dec 28 high and the bulls need follow-through buying to increase the odds of a retest of the all-time high. The bears want the Emini to stall around the December 28 high area or the trend channel line area. S&P500 Emini […]
Crude Oil Sideways Trading Range
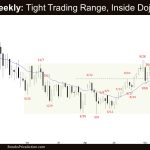
Market Overview: Crude Oil Futures The weekly chart formed a Crude Oil sideways trading range with overlapping bars. The bulls will need to create follow-through buying trading above the 20-week EMA to increase the odds of the bull leg beginning. The bears want another leg down to retest the prior leg low (Dec 13) and […]
EURUSD Tested the 20-Week EMA
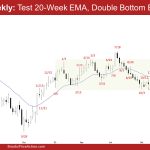
Market Overview: EURUSD Forex The weekly chart: the EURUSD tested the 20-week EMA in a two-legged pullback. The bears need to create a few strong consecutive bear bars closing below the 20-week EMA to increase the odds of retesting the trading range low. The bulls want the 20-week EMA to act as support, followed by a […]
Bitcoin Doji as a Follow Through Bar of a Bear Reversal Bar
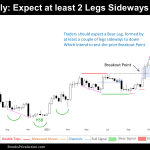
Market Overview: Bitcoin In the past week, a noticeable Bear Signal sent ripples through the Bitcoin market, raising questions about the potential shift in sentiment. The follow-through bar, observed at the time of this report, takes the form of a doji bar, managing to close above the prior weekly lows. Traders are now closely monitoring […]
FTSE 100 Triangle, Bull Breakout Test of 100-Week MA
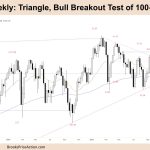
Market Overview: FTSE 100 Futures FTSE 100 futures moved lower last week back top test the apex of the triangle and the 100-week moving average (MA.) Deep pullbacks, disappointment and strong near the extremes. Trading range price action. That could lead to buyers here, as buying this MA has been a good trade historically. FTSE […]
DAX 40 Bull Flag, High in Trading Range, Micro Wedge
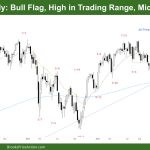
Market Overview: DAX 40 Futures DAX futures moved lower last week in a bull flag with a bear doji. Sideways price action after a big move up. Price had a hard time getting through 17000 last time. The bulls want a good double bottom here to move higher. It’s still above the 200, so most […]
Nasdaq 100 Good Follow-Through to the Bull Reversal Bar of 1-8-2024
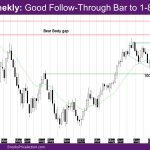
Market Overview: NASDAQ 100 Emini Futures The NASDAQ Emini futures week is a big bull trend bar with a tail below. It is a good follow-through to the bull reversal bar of 1-8-2024. Given the strength of this leg, there should be another leg up. On the daily chart, the market broke out from the […]
Nifty 50 at Big Round Number
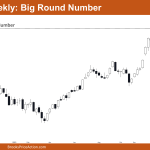
Market Overview: Nifty 50 Futures Nifty 50 Big Round Number on the weekly chart. On the weekly chart, a notable event unfolded as the market formed another outside bar pattern, hinting at a potential increase in trading range price action. Despite a weak bear close this week, it is insufficient to reverse the prevailing strong […]
Emini Bulls Want Trend Continuation
Trading Update: Friday January 19, 2024 S&P Emini pre-open market analysis Emini daily chart Emini 5-minute chart and what to expect today Yesterday’s Emini setups Al created the SP500 Emini charts. Here are reasonable stop entry setups from yesterday. I show each buy entry bar with a green arrow and each sell entry bar with […]
Emini Bears Need More Signs of Strength
Trading Update: Thursday January 18, 2024 S&P Emini pre-open market analysis Emini daily chart Emini 5-minute chart and what to expect today Yesterday’s Emini setups Al created the SP500 Emini charts. Here are reasonable stop entry setups from yesterday. I show each buy entry bar with a green arrow and each sell entry bar with […]

