Trading Update: Wednesday January 17, 2024 S&P Emini pre-open market analysis Emini daily chart Emini 5-minute chart and what to expect today Yesterday’s Emini setups Al created the SP500 Emini charts. Here are reasonable stop entry setups from yesterday. I show each buy entry bar with a green arrow and each sell entry bar with […]
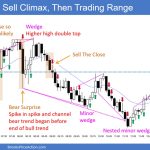
Emini March 2022 Magnet Above
Trading Update: Tuesday January 16, 2024 S&P Emini pre-open market analysis Emini daily chart Emini 5-minute chart and what to expect today Friday’s Emini setups Richard created the SP500 Emini chart. Here are reasonable stop entry setups from Friday (before US holiday break). I show each buy entry bar with a green arrow and each […]
Emini Retested the December High
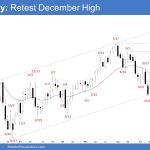
Market Overview: S&P 500 Emini Futures The S&P 500 Emini retested the December high following a 1 bar pullback on the weekly chart. The bulls want a breakout above the December 28 high and retest the all-time high. The bears want the market to stall around the December high area and form a Low 2 sell setup. […]
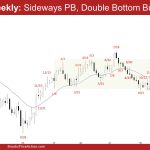
Crude Oil Sideways Pullback
Market Overview: Crude Oil Futures The weekly chart is forming a Crude Oil sideways pullback below the 20-week EMA and the bear trend line. The bears want another leg down from a double top bear flag. The bulls will need to create follow-through buying trading above the 20-week EMA to increase the odds of higher […]
EURUSD Stall at the 20-Day EMA
Market Overview: EURUSD Forex The pullback in the EURUSD stall at the 20-day EMA on the daily chart. The bears want a reversal from a small double top bear flag. The bulls want the 20-day EMA and the bull trend line to act as support and resume the bull leg higher. EURUSD Forex market The […]
Bitcoin strong bear reversal bar after 2022 High
Market Overview: Bitcoin The Bitcoin price ascended to meet the 2022 High price magnet, trading upward as expected. However, the narrative took a sharp turn thereafter, with a formidable reversal that saw the price plummet by over $7500. This week’s weekly bar is a Bear Reversal bar, prompting the pivotal question: Has the market initiated […]
Nifty 50 Outside Bar
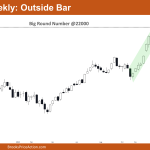
Market Overview: Nifty 50 Futures Nifty 50 Outside Bar on the weekly chart. The weekly chart indicates a strong bull close following the indecisive doji bar of the previous week. Nifty 50 maintains its position within a robust tight bull channel and is approaching the formidable big round number 22000, a significant resistance level. On […]
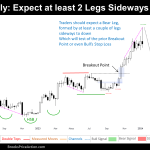
FTSE 100: Sell Signal Triggered, Breakout Pullback
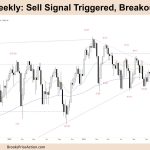
Market Overview: FTSE 100 Futures FTSE 100 futures moved lower last week, triggering a sell signal. The bulls got a streak out of the apex of a triangle, and we expected a test back down to the BO point. We touched the channel line again, and bulls need to create buying pressure here again to […]
DAX 40 IOI – Final Flag or Breakout Mode Reversal
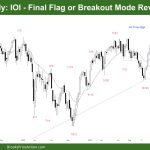
Market Overview: DAX 40 Futures DAX futures went sideways last week with an inside-outside-inside pattern (ioi.) The bulls see a final flag before one more leg up. The bears see a parabolic wedge, a tight channel up at the top of an expanding triangle. No good signals in 5 bars is TR price action, so […]
Nasdaq 100 Two-Bar Reversal with 1-1-2024?
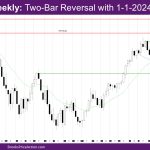
Market Overview: NASDAQ 100 Emini Futures The NASDAQ Emini futures week is a big bull trend bar with a small tail above and below. It could be a two-bar reversal with 1-1-2024 – Its body overlaps with the body of week of 1-1-2024. This week went above last week’s high and closed slightly below last […]

